Ever wondered what’s really happening behind the scenes in your work processes? Every action you take, every click, every update, every task, creates a digital trace. Process mining is all about connecting those dots to reveal how things actually get done, beyond what you think or assume. In this guide, you’ll discover exactly what process mining is, why event logs matter, and step by step you’ll learn how to create your very first event log.
By the end, you’ll not only have built your own event log, but you’ll also be able to answer one honest, eye-opening question about how your process truly works. Ready to see your workflow in a new light? Let’s get started.
Quick glossary
Process mining has some very specific terms that are often used. Let’s take a quick look at some of the most common process mining terms and see what they mean:
· Case: the thing you follow end to end. A PO, an order, a claim, a ticket. It’s an identifier that ties different events / activities together.
Activity: a named step in the process like Create PO or Goods Receipt.
Timestamp: when the step happened.
Lifecycle: start or complete when a step has two times. Sometimes it can be useful to measure how long a step in the process takes. Here we don’t have just a single timestamp but two.
Variant: a unique path a case takes through the steps. We’ll look at variants to understand the different paths that exist within your process.
Conformance: how close the real path is to the expected path. Usually you have an idea how the process has been designed. We call this the ‘happy path’. With conformance checking we validate how many times the process has followed the happy path, or if there are any deviations.
Event log: the tidy table that holds all events for all cases. It’s the basis data you need to run a process mining analysis.
Example case
Throughout this guide well look at one specific example, i.e. case, that we’ll follow through the different process steps.
Say we track purchase orders. Meet PO 45001234. It gets created on Monday, approved on Tuesday, partly received on Thursday, invoiced next week, and paid the week after. We will keep coming back to this PO as we build the event log so you can see how the pieces click together.
First things first, what is process mining?
Before we dive into the nitty gritty technical details it’s sensible to take a step back and ask ourselves the question what process mining is, and shy we should care. We shouldn’t jump into any type of analysis, process mining or another, just because it looks cool. It needs to server a purpose. So, what is process mining...
Process mining looks at the actual digital trail in your systems and rebuilds the flow of work. It is different from a swimlane or flowchart drawn in a workshop. It is the observed truth. It’s a representation of what has actually happened, not what we believe is happening. You use it to find where work waits (bottlenecks), where it loops back (rework), and where rules get skipped (compliance).
End goals you can point to:
Transparency. See who did what and when for each case.
Performance. Measure cycle time, waiting time, touchless rate, automation rate.
Conformance. Compare real paths to policy.
Root cause. Find which factors drive rework and delay.
Improvement. Target fixes, track impact, and scale what works.
Ok, now that we have an understanding of what process mining is and what we can get out of it the next obvious question is: how do you start with process mining? The basis for any process mining analysis is the event log.
The event log
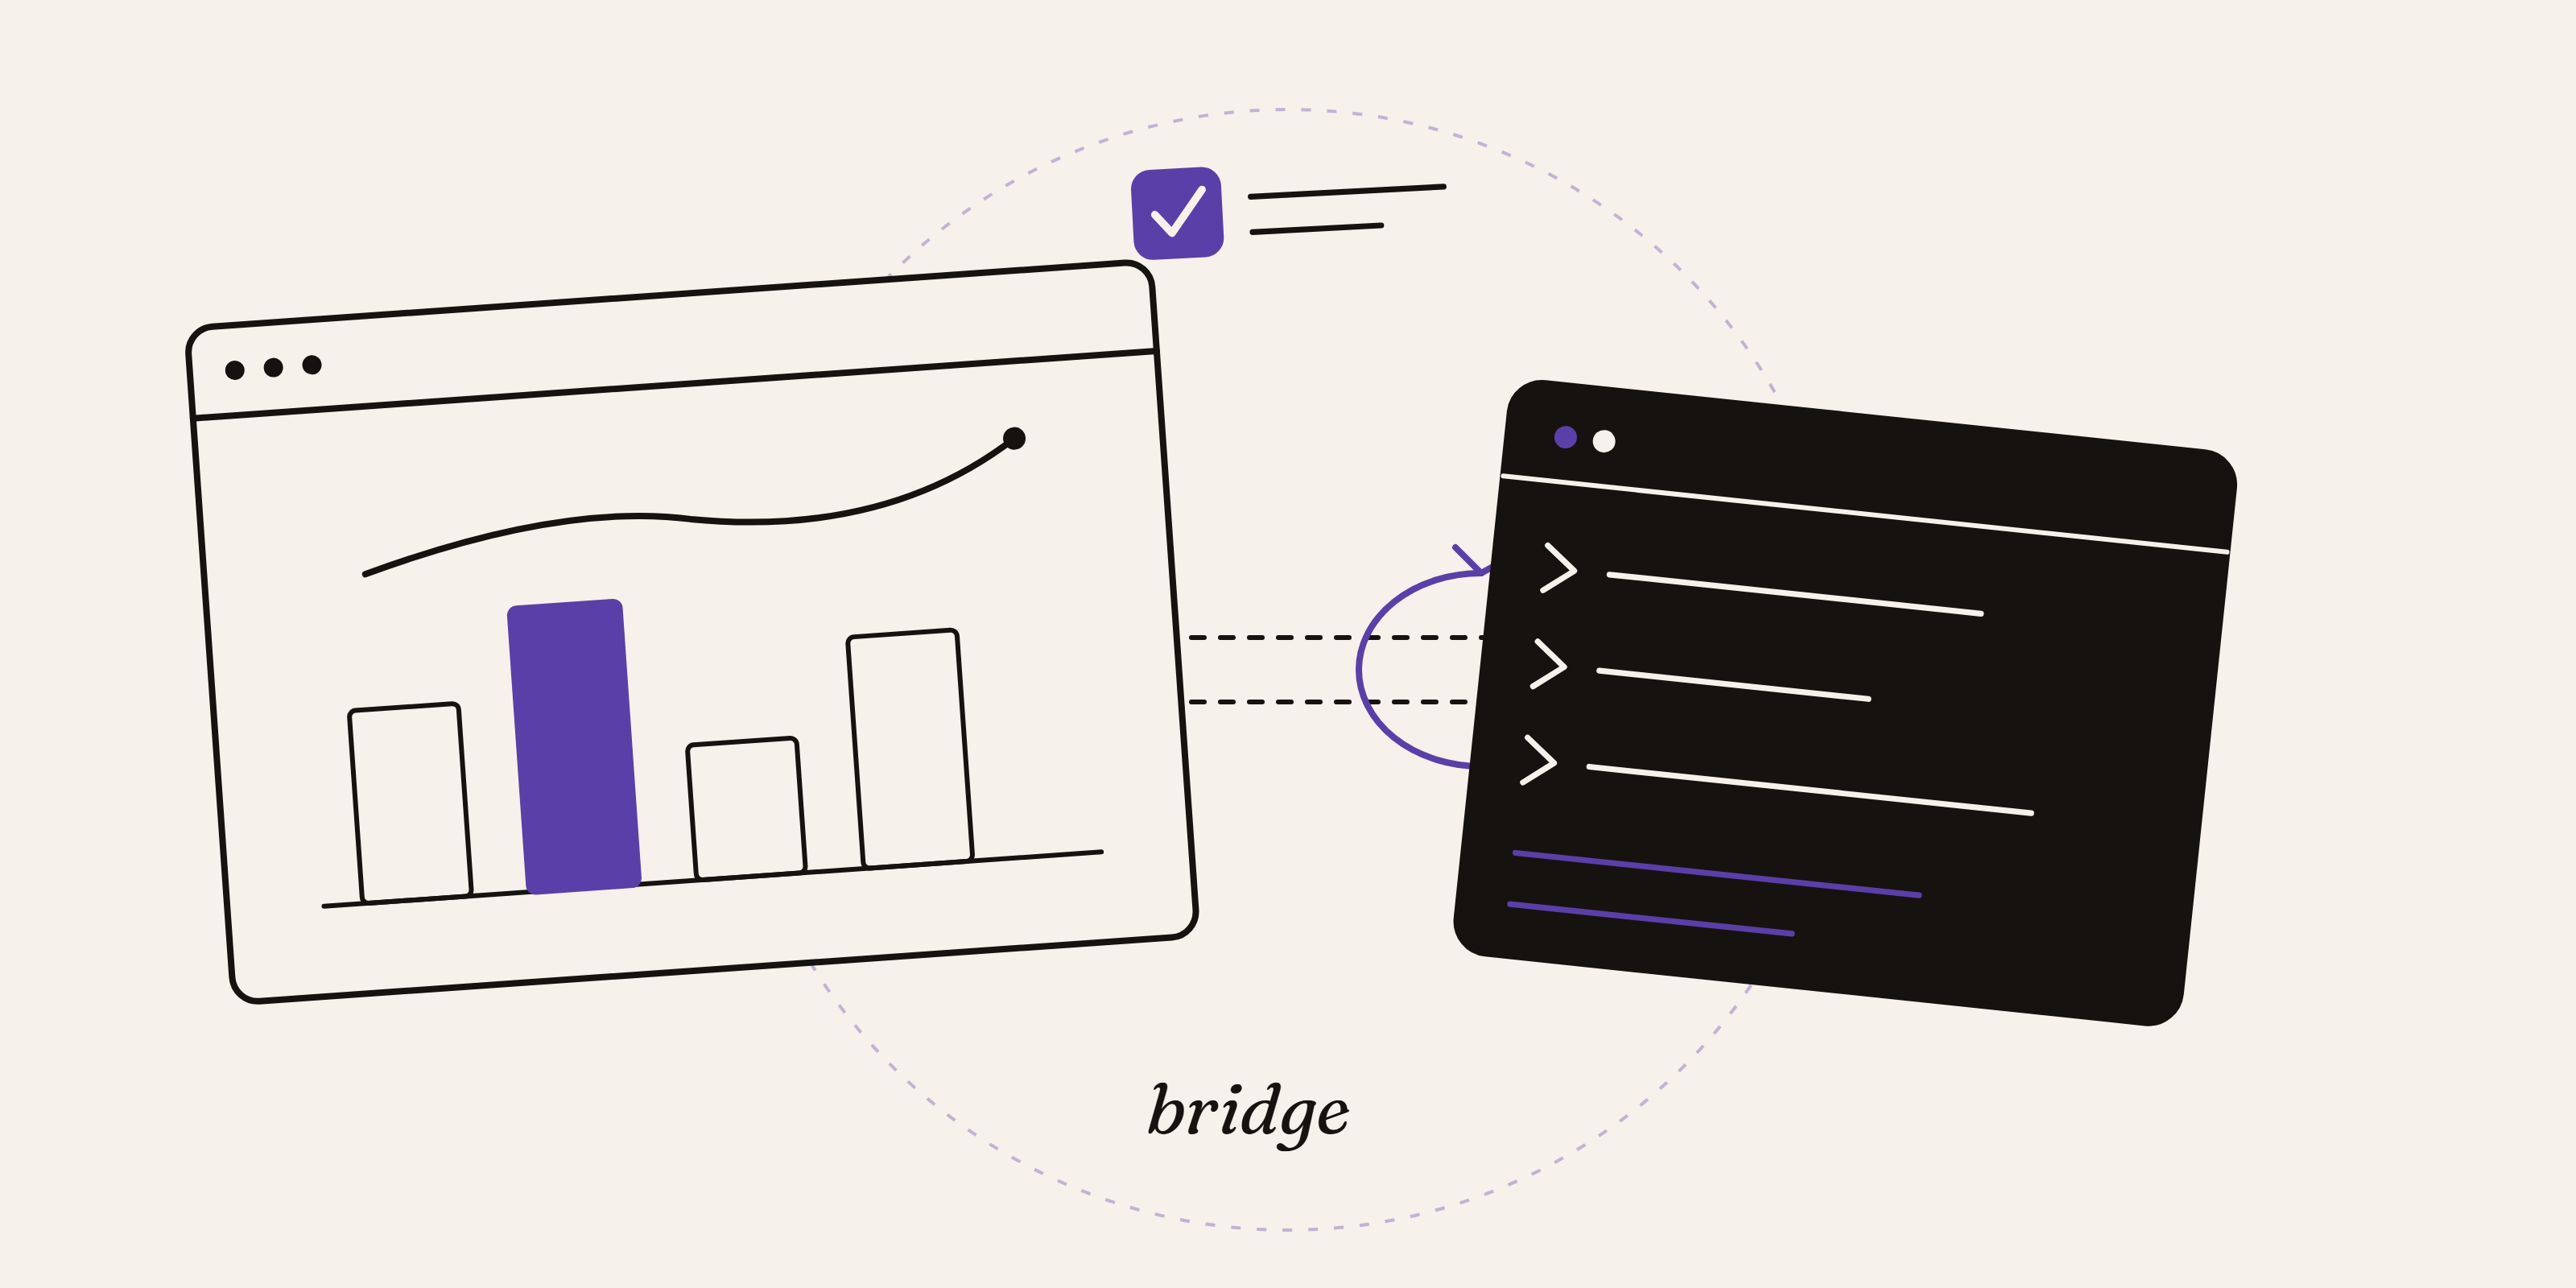
Before any model or dashboard you need an event log. Think of it as a long table where each row is one event for one case. If PO 45001234 gets created, approved, received, invoiced, and paid, that is five rows (i.e. activities) tied to the same case id. The log is the bridge between messy source data and clear process views.
A good event log is essential. Every chart and metric depends on it. If the log is wrong, the insights are wrong.
And building the event log is the trickiest past of a process mining analysis. Real data sits in many systems. Timestamps use different time zones. IDs do not line up. One action can appear in several tables. Some links are one to many, others many to many. You will have make some design choices. Those choices depend on the questions you try to answer.
In this guide we’ll take a look at some different scenarios so you’ll have a better understanding of the design process of an event log.
Building blocks of an event log
You only need a few pieces to get going.
Case id. The id of the thing you follow. Examples: po_id, order_id, claim_id. Pick the level that matches your KPI. If the KPI is per line, use a line id.
Activity. A clear name for the step. Use business words. Examples: Create PO, Approve L2, Goods Receipt, Post Invoice, Payment Cleared.
Timestamp. When the step happened. If you have both start and end you can measure service time inside a step.
Attributes. Extra context. Amount, currency, vendor, customer, plant, approver, channel, priority. These unlock deeper questions.
Event id. A unique id per row. It helps with auditing the reults.
Lifecycle. Start or complete for steps that span time.
A minimum log has case_id, activity, timestamp. Add event_id and lifecycle when you can.
While attributes are not a necessity to start with process mining or construct the process mining visuals they are very important to analyse and understand your data. If you just draw a process map you can visually tell if something is wrong. But then you need to understand and explain what is happening. It’s here that attributes come in. Maybe it are invoices from a given vendor that follow a different path, transactions coming in via an interface follow a different path compared to manual entries, a given user is deviating from the standard... There can be many explanations. By adding attributes to your data, your data get’s context. The more context you can add the more options you have to understand what is really happening in your organisation. Attributes also help you to do benchmarking, such as comparing processes at different locations.
It’s not always possible to know all the attributes you’ll need upfront but try to cater for then as much as possible during the design phase. If you’re not sure if an attribute will be useful or not but it’s low effort do add it, I would do so. You can always decide to hide some attributes in the visualisation phase of they’re not relevant.
Starter schema and a tiny sample
Minimum schema
case_id
activity
timestamp
Optional but useful: lifecycle, event_id, resource, amount, currency, vendor_id, plant, source_system
Five sample rows
case_id | activity | timestamp | resource | amount | vendor_id |
45001234 | Create PO | 2025‑03‑03 09:12 | buyer01 | 7,500 | V‑9001 |
45001234 | Approve L1 | 2025‑03‑03 10:05 | mgr17 | 7,500 | V‑9001 |
45001234 | Goods Receipt | 2025‑03‑06 14:22 | whs22 | 4,000 | V‑9001 |
45001234 | Invoice Posted | 2025‑03‑10 11:31 | ap07 | 7,500 | V‑9001 |
45001234 | Payment Cleared | 2025‑03‑18 16:40 | system | 7,500 | V‑9001 |
From this you can already measure waiting time between steps, see the partial receipt, and link time to money.
"High-value cases often reveal the biggest opportunities for impact, follow the amounts."
What extra columns add
Now that the basics are clear, a few smart columns open new doors. Add what helps answer your first question.
Resource or role. Spot handovers and team bottlenecks. Question it answers: where do cases slow when moving between groups.
Amount and currency. Value weight your KPIs and show working capital. Question it answers: which slow steps tie up the most cash.
Due date or promised date. Run SLA analysis. Question it answers: who is late, by how much, and why.
Priority. Check if urgent work moves faster.
Location or plant. Compare sites and tailor fixes.
Reason code or change type. Separate rework from normal flow.
Approval level and approver. Reveal slow points in the approval chain.
Payment terms and discount terms. Show discount loss and its causes.
Calendar id. Switch to business hours instead of wall clock.
Related document ids. Keep invoice_id, delivery_id, ticket_id to run cross checks like three way match.
You do not need all of these. Pick the ones that line up with your goals.
From idea to event log
Now that you understand the basic structure of an event log we’ll go a bit more in depth into the design and construction of an event log. These are the nine steps to build a quality event log:
1) Clarify the question
Pick one or two questions. Examples: where do POs wait the longest from creation to payment. How often do shipments go out in partials and why. Your question drives the case level and the joins. It’s an important first step. You need to know why you want to use process mining because it drives the design choices of the event log.
2) Pick the case level
If leadership cares about time from PO creation to last payment per PO, use the PO header. If they care about three way match by item, use the PO line. The wrong level hides the issue you want to see.
3) List activities and where they live
Create a one page map. For procure to pay you might have: Create PO in the PO header table. Line approval in the approval table. Goods receipt in the GR line table. Invoice posted in the AP invoice table. Payment in the payments table.
You’ll have to understand granularity. Data can exist at different levels. In our example of the PO we have header and line level data. Header data are thinks like the user that has created the document, the vendor, shipping address etc. It’s data that is shared across the lines. The lines are the actual items you plan to order, the materials and services, quantities and price.
No you’ll have to determine where action data is logged. Is there a timestamp on the header level or on the line level? It can be either of them depending on the activity. It’s also dependent on the system you use.
4) Extract and reshape
From each source select the case id, a clean activity name, the timestamp, and a few helpful attributes. Keep a column for the source system. Bring all sources into the same column layout. Stack the rows into one tall table.
5) Standardize time
Convert to the same time zone, if your organisation is active in different geographies. Keep an optional local time column if people need it. If you only have dates, set a default hour and flag the low precision. Now your time math is consistent.
Standardisation of time zones is often overlooked if you’re just active in one geography and make the assumption that all timestamps are the same across you systems. This is not always the case. The timestamp you see on your screen in an application might not be how it’s stored in the underlying data. One software vendor might store timestamps in a local timezone, another vendor might store all timestamps in UTC.
Always check your data and apply the relevant conversions.
6) Order events and assign a stable id
Sort by timestamp. Break ties with lifecycle, a source sequence number, or extraction order. Create a unique event id from native keys and the timestamp. It makes auditing your data a lot easier if every record in your event log has a unique id that is also easily traceable to the source data. When you spot a specific case you want to investigate you often want to be able to go into the underlying source systems and look up the transactions to better understand what is happening.
7) Clean and enrich
In this step, you should focus on ensuring the quality and completeness of your event log data before proceeding with analysis. Start by removing exact duplicates, these are rows in your dataset that have identical values across all columns. Duplicates can occur due to multiple data extractions or system errors, and they can distort analysis if not eliminated.
Next, join relevant master data to your event log. This involves enriching your event log with additional attributes from reference tables, such as vendor group, payment terms, or organisational hierarchy. By bringing in this master data, you add important context to each event, making it easier to interpret and analyse process flows in relation to business structure or rules.
After enrichment, compute case-level metrics for each process instance (case). For every case, determine and record the case start (the timestamp of the first event) and the case end (the timestamp of the last event).
Optionally, assign an event index to every event within a case, indicating its position in the sequence. This event index help tracing the exact order of activities within each case and helps with downstream analysis, such as identifying bottlenecks or rework loops.
8) Validate with people
Count missing timestamps, events per case, and out of order steps. Then sit with process owners and walk through a few real cases. If they say this is not how we work, adjust names or joins.
9) Store and refresh
When you want to analyse or share your event log, picking the right file format is important. The best format depends on what you want to do and which tools you use:
· CSV (Comma-Separated Values): This is a simple text file where each row is an event and each column is a piece of information. CSV files are easy to make, easy to read, and work with most spreadsheet programs and analysis tools. They are good for quick checks or small amounts of data.
· Parquet: This format is better for large amounts of data. It stores data in a way that saves space and is faster to read when you have lots of information. Use Parquet if your event log is big or will get bigger, especially if you use tools like Apache Spark or Azure Data Lake.
· XES (eXtensible Event Stream): XES is specially made for process mining. It uses XML and can include a lot of extra details about each event. Many process mining tools (like ProM, Celonis, or Disco) can use XES files. If you want to do serious or repeated process mining, XES is a good choice.
· OCEL (Object-Centric Event Log): Use OCEL if you need to track complex connections, like when one invoice links to many orders. OCEL is designed to handle these kinds of relationships.
If you plan to do process mining regularly, XES is usually the best option. It helps keep things standard and makes it easier to update and compare your analyses.
No matter which format you choose, remember to update your data regularly. If there are changes, make sure to rebuild any cases that have new events so your analysis stays correct.
Simple construction examples
Order to cash across three tables
You have orders, warehouse picks, and shipping. The event log for order 1001 might look like this.
case_id | activity | timestamp | resource | channel | amount |
1001 | Create Order | 2025‑07‑01 10:21 | web | web | 120.00 |
1001 | Pick Start | 2025‑07‑01 12:05 | u123 | web | 120.00 |
1001 | Pick End | 2025‑07‑01 12:18 | u123 | web | 120.00 |
1001 | Ship | 2025‑07‑01 16:44 | system | web | 120.00 |
You can now measure pick duration, queue time to ship, and channel effects.
Purchase to pay at line level
For three way match, set the case to the PO line. Tie GR lines and invoice lines to the same po_line_id. If an invoice only holds the PO header and material code, build a small mapping that links invoice lines to PO lines on PO id plus material plus quantity with a tolerance. Now you can see where matching fails and how long it takes.
Combining data sources without getting lost
You will join across systems. Keep it simple and predictable.
Carry both the analysis key and the native document keys. Example: case_id equals po_line_id, plus invoice_id and gr_id for reference.
When master data changes over time, snapshot it as of the event date. That keeps attributes true for old events.
If the same action appears in two places, pick one system as the source of truth for that activity and note it in your log.
For incremental loads, pull changes since the last run and rebuild any case that changed. This keeps traces whole.
Design choices you must make
These choices depend on your goal. There is no single right answer. Pick the model that answers your KPI with the least distortion and be clear about what it will not answer.
Header vs line as the case
Header level fits questions like time from PO creation to last payment per PO. It is simpler and lighter. It hides partial receipts and line rework.
Line level fits questions about three way match, item holds, and partials. It is richer and heavier. Mapping invoices to lines takes care.
Scenario
Goal: approval speed by spend bucket.
Choice: header if approvals live at header. Line if approvals differ by item or plant.
Why: your case should match the decision point that controls time.
One to many and many to many links
Many PO lines to one invoice line
Choice A: duplicate the invoice event onto each linked line and allocate amount per line. Good for line KPIs. Keep finance math honest.
Choice B: keep invoices as their own object and analyze links across objects. Good for clean finance math and cross object views.
Many invoices to one PO
Header case shows repeated Invoice Posted events. Good for time to first and last invoice.
Line case shows which items got invoiced when. Needed for hold analysis and partials.
Order split into several shipments
Order case gives time to first ship and time to complete.
Delivery case focuses on carrier and warehouse metrics.
Activities with a duration
If you have start and end times, store both and add a simple lifecycle field. If you only have one time, separate waiting from doing by looking at the gap to the next event, or use queue timestamps when you have them.
Event granularity
Status fields can flip many times with little meaning. Combine them into one business friendly activity name. Keep the raw status in a separate column for audit. This keeps the model readable.
When to consider object centric logs
If you copy the same event to many cases, you likely have a web of objects that move together. Think PO lines, invoices, deliveries, and returns. An object centric event log lets one event reference several objects at once. It avoids row explosions and keeps finance math clean. Setup is a bit more advanced, but it pays off for cross object questions.
A short technical detour that helps later
Time zones. Store timestamps in UTC. Keep a timezone_offset if local views matter.
Ordering ties. If two events share the same second, use lifecycle, a source sequence number, or a simple tie breaker so the order is stable.
Unique event id. Build a stable id from native keys and time. Random ids make audit harder.
Dedup. Remove exact duplicates and near duplicates, like two identical events within a few seconds from the same source.
Business hours. Use a calendar when you care about working time.
Data types. Timestamps as datetime, amounts as decimal, ids as string to keep leading zeros.
You do not need all of this on day one. Add what your questions demand.
Pitfalls you will meet and easy fixes
Only dates, no times. Pick a default hour and flag low precision. The math will still work for most questions.
Mixed clocks. Convert to UTC. If one source is always off by a fixed offset, correct it and document the rule.
Weak joins. If you match invoice lines to PO lines on partial keys, score the match quality. Use high scores for strict checks.
Row explosions. If copying events multiplies rows, either allocate amounts per link or move to an object centric model.
Deletes in sources. Do not drop history. Record cancels and returns as events with negative quantities or credit amounts.
Event storms. Collapse identical auto events that fire every few seconds. Keep one with a count if useful.
Governance, privacy, and audit
Event logs often contain names and emails. Mask personal data if policy requires it. You can has or anonymize sensitive data. Some data you don’t need into a ‘human readable’ format to do the process mining analysis. Once you identified specific cases if interest you could always look up the underlying data. That way you’re only consulting sensitive data on a ‘need to have’ basis.
You can also separate the lookup capabilities. E.g. when you work with employee data you could anonymise the data and data analysts only work with the anonymised data. Identified cases are handed over to the HR team and only they can see the persons behind it.
Keep raw document ids and the source system for each row so every event is traceable. Store a short data contract that lists each column, its meaning, and its data type. This makes handovers and audits calm.
Analysing your process mining data
Once your event log is set up, you’re ready to see how your process works in real life. Here are three easy ways to check if things are running smoothly:
· Median cycle time from first to last activity
· This shows you how long a case, like an order or a ticket, usually takes from beginning to end. The “median” is just the middle result, so you don’t get distracted by a couple of super slow or super quick cases. It’s a handy way to spot if your process is dragging anywhere.
· Top five variants by volume and their median cycle time
· A “variant” means a different way a case can move through your steps. Looking at the five most common paths and how long each one takes helps you see which ways are popular and if some are much slower than the rest. That makes it easier to know where you should try to speed things up.
· Share of cases that skip or repeat a key activity
· Sometimes, steps get missed or done more than once. Measuring how often this happens shows you if there are any gaps or bits that keep getting redone. It’s a good way to find things you can fix to make your process more reliable.
Why bother with these numbers? Because they’re quick to figure out and tell you a lot about what’s working and what’s not. You’ll see where things are flowing well and where you might need to make changes. It’s a solid starting point before you dig deeper.
How to Look at Your Data
When you first check your process data, group things together, like batches of orders or tickets, instead of looking at one case at a time. You’ll spot trends much faster this way. Maybe you’ll notice one team always takes longer or one route through your process keeps popping up.
Filter your data using things like amount, team, region, or product type. This helps you view your process from different sides and test your guesses. For example, if you think big orders move quicker, just filter by amount and see if that’s true. These filters make it simple to check your ideas and find problems you didn’t expect.
It’s in this step that having attributes in your data really helps you to group transactions and understand what’s happening.
Diving Into the Details
If something stands out, like a sudden jump in cycle time or lots of cases skipping a step, take a closer look at those particular cases. See if they have anything in common, like coming from the same department or involving the same product. This helps you move from broad stats to practical fixes.
Keep in mind, the point is to use your data to ask smarter questions. Look at the big patterns first, use filters to test your thinking, and only zoom in on individual cases when you really need to figure out what’s going on. This way, you’ll get more out of your process mining and actually make things better.
Recap
An event log is a tidy table that tells you who did what and when for each case. Choose the right case level for your KPIs. List the activities. Standardize timestamps. Keep each event unique and ordered. Add a few smart attributes like amount, role, due date, and payment terms to unlock useful views. Handle one to many with intent. If links get messy, consider an object centric model. Validate with the people who run the process. Refresh on a schedule and track data quality.
Practical tips and a starter checklist
Tips
Start with one process, a few activities, and one system.
Name activities in plain language. Keep raw codes in a separate column.
Carry both header and line ids when possible. You can switch views later.
Add amount early. It focuses decisions.
Use UTC. Add business calendars when needed.
Rebuild any case touched in the last few days to pick up late events.
Checklist
Clear question and matching case level
Defined list of activities with sources
Columns set: case_id, activity, timestamp, event_id, lifecycle, resource, amount, currency, key attributes, source_system
Timestamps in UTC and ordering rules set
Dedup rules and data quality flags in place
Master data joined as of event date
Validation with process owners done
Storage format chosen and refresh plan set
You do not need new software to begin. You need one tidy table. Pick one process. Pick one question. Build your first event log with three columns and a handful of activities.
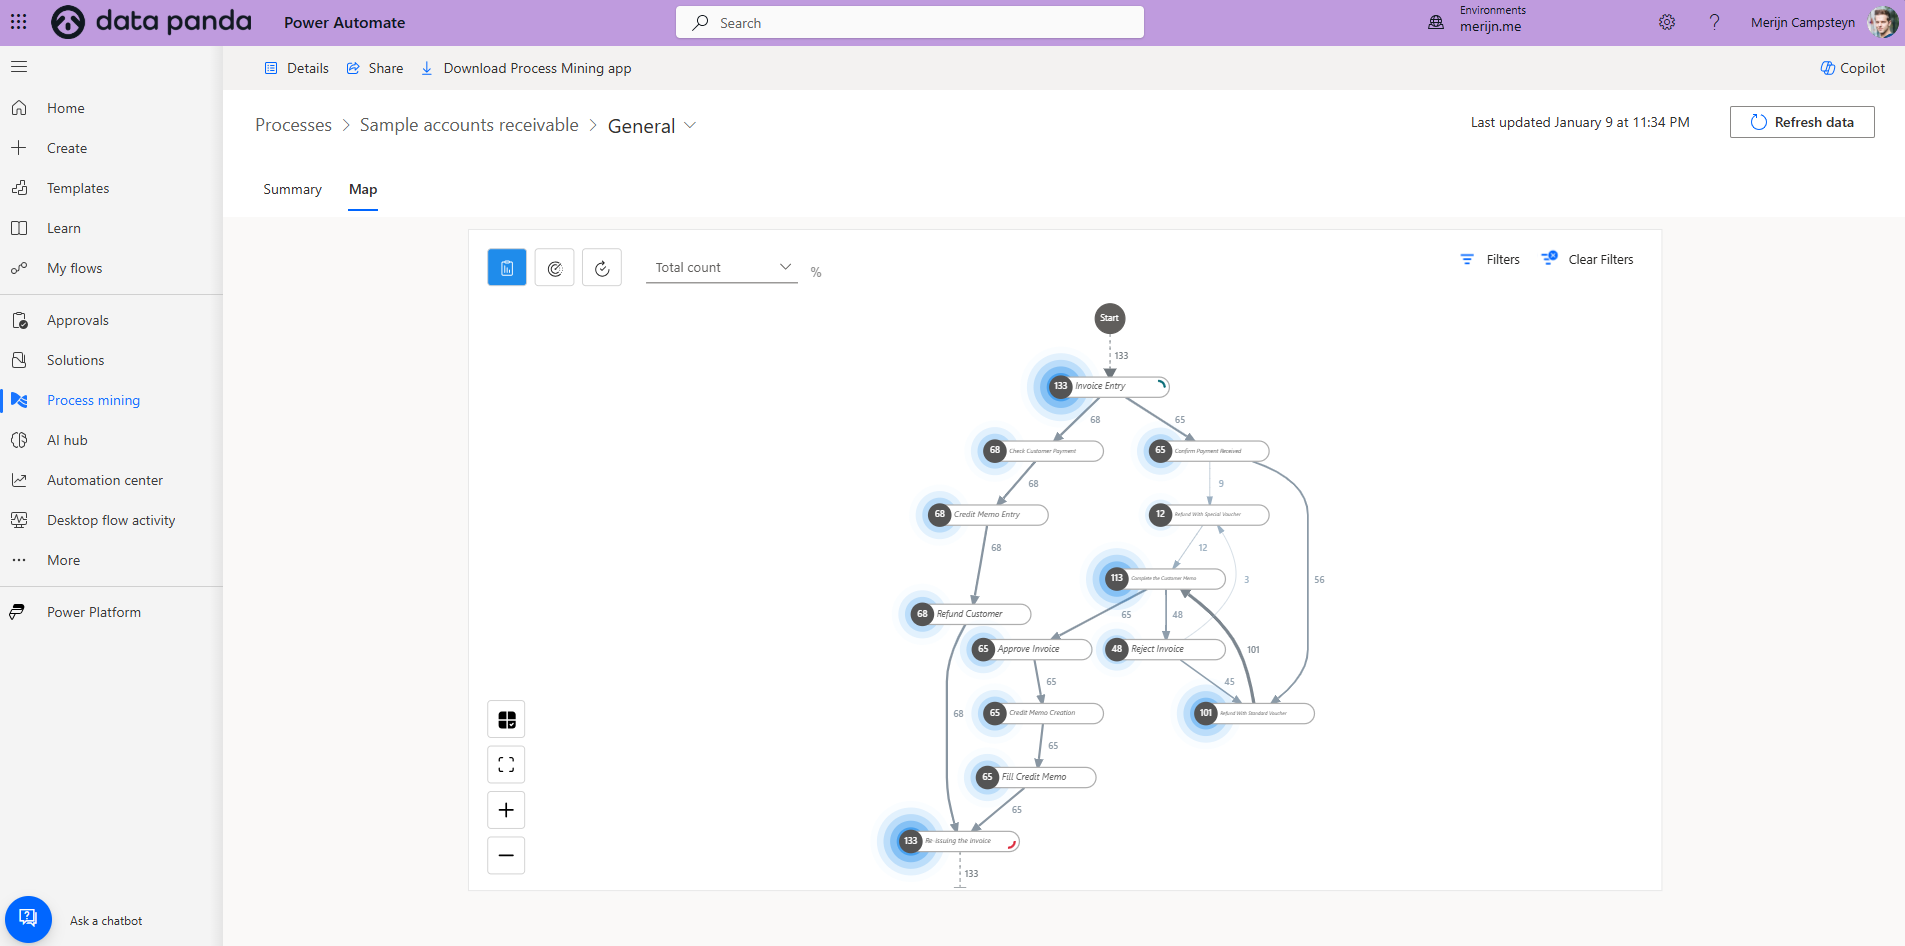
Process mining used to be an enterprise play. Process mining tools were expensive, and they still can be. But there are affordable alternatives available. Our favourite go to tool is Power Automate. It’s not well known to the public but Microsoft Power Automate a process mining feature. It’s powerful and very affordable. At the time of writing this article a Power Automate license is only 9 dollars per user per month.
Continuous validation helps you catch data issues before they become decision risks.
Process Mining: Frequently Asked Questions (FAQ)
General Process Mining
What is process mining?
Process mining is a technique that analyses event logs from IT systems to discover, monitor, and improve real processes by extracting knowledge from the data available in the systems. It helps visualise workflows, spot inefficiencies, and drive better business decisions.
Why should I use process mining?
Process mining gives you a clear, data-driven view of how your processes actually run, rather than how you think they run. It helps you identify bottlenecks, compliance issues, and opportunities for automation, making your operations more efficient and reliable.
What data do I need to start process mining?
You need event logs containing information such as case IDs (to track individual process instances), activity names, timestamps, and ideally additional attributes such as amount, product type, or responsible team. The more complete and accurate your event log, the better your insights.
Data Preparation and Quality
What if IDs do not match across systems?
Build a mapping table to relate IDs from different systems. Score the quality of these matches, and use only high-confidence matches for conformance and performance checks to ensure reliable results.
What if the same event shows in two places?
Select one source of truth for each activity. Clearly document your choice in the log to avoid double-counting and inconsistencies during analysis.
When do I need object-centric logs?
If you frequently link one event to multiple cases, or need accurate financial calculations across documents (such as invoices connected to several orders), switch to an object-centric log model. This approach offers flexibility when relationships become complex.
Can I start without lifecycle start and complete data?
Yes, you can begin process mining without lifecycle information. You will still be able to measure wait times between events. Add lifecycle data later to enhance your analysis with more precise timing and activity duration insights.
How can I ensure my event log is suitable for analysis?
Standardise timestamps, keep each event unique and ordered, and include key attributes like amount, team, and due dates. Validate your event log with the people who run the process to catch errors before starting your analysis.
What should I do if my data quality is poor?
Start by identifying gaps or inconsistencies using basic statistics, such as missing steps or duplicate events. Work with data owners to improve quality, and document any assumptions or corrections you make during preparation.
Analysis and Interpretation
How do I group and filter my data for analysis?
Group data by cases (such as orders or tickets) or relevant attributes (like region or product type). Use filters to test hypotheses (e.g., do larger orders process faster?) and to uncover patterns or anomalies that need addressing.
When should I look at individual cases?
Start with broad patterns and only drill down to individual cases when you spot unusual behaviour, such as sudden spikes in processing time or frequent skipped steps. Investigating these cases helps identify root causes and practical fixes.
How often should I refresh my process data?
Set a regular refresh schedule that fits your business needs, daily, weekly, or monthly. Automate updates where possible and always check for late or backdated events by rebuilding any cases affected in the last few days.
Getting Started and Practical Tips
What’s the best way to start process mining?
Begin with a single process, a small set of activities, and one system. Use plain language for activity names, keep raw codes separately, and include both header and line IDs if available for flexible views. Use a simple and affordable process mining application like Power Automate.
Why is the “amount” attribute important?
Including transaction amounts early helps focus your analysis on high-value cases and ensures that financial impacts are considered in process improvements.
Should I use business calendars?
Yes, especially if your operations do not follow a 24/7 schedule. Adding business calendars improves the accuracy of cycle time and waiting time calculations. Depending on the question you want to answer you can look differently at dates and time.
E.g. if we look at customer experience the time to deliver an order can be an important metric. The customer doesn’t care about our operating hours. The relevant metric here is the time between order and delivery. If on the other hand we look at internal throughput and time spent on the fulfilment of the order we might need to take operating hours into account. If we started to work on an order on day way, then there was the night, and then we continued to work on the order the next day we shouldn’t count the night hours as active time we worked on the order.
Troubleshooting and Next Steps
What if my process changes over time?
Keep track of process versions and major changes. Use attributes like effective date or process version to distinguish between different variants during analysis.
How do I handle exceptions and rare cases?
Flag exceptional cases in your log using a dedicated attribute. Analyse them separately to avoid skewing your main process metrics.
How can I validate my findings?
Discuss your process maps and findings with team members who operate the process daily. Their feedback will help confirm or challenge your conclusions, leading to more robust improvements. Sometimes there is an issue with the process, but there might also be an issue with the data or your analysis. Always confirm and validate before jumping into conclusions.