How to enable the Power BI Desktop Bridge (and the CLIs the docs leave out)
The June 2026 Power BI Desktop Bridge lets an agent build and verify reports. Here is how to enable it and install the two CLIs the docs leave out.
ReadWe build applications that find information, process documents, prepare checks and flag changes in your numbers. First, we work out where AI is useful. Then we build something that fits the way your team already works.

Where we can help.
Extract information from invoices, purchase orders, contracts or emails and prepare it for the next step.
Help employees search manuals, procedures and customer information, with the source included in each answer.
Bring unusual transactions, changes in performance or cases that need attention to the surface.
Use historical information to estimate demand, inventory, cash flow or workload more accurately.
A few examples of processes where data, documents and decisions come together.
An application reads a supplier invoice, finds the related purchase order and delivery, and compares the details. The finance team sees only missing or conflicting information and decides what happens next.
Incoming messages are sorted and combined with relevant customer and product information. The employee gets a summary and a suggested response, while remaining in control of what is sent.
Employees ask a question in ordinary language. The application searches the documents they are allowed to access and shows the answer with its source, so they can check it themselves.
Sales history, seasonality and other known influences are brought together in a forecast. Planners see where expectations are changing and can use that information in their own decisions.
You do not need to choose a model or technology beforehand. We start with the process and work out what is feasible.
We look at where information comes from, which steps are manual and who makes each decision. Result: one defined use case and a clear view of what it requires.
We test it with examples from the process and agree in advance how it will be assessed. Result: a working pilot your team can try for themselves.
If the pilot proves useful, we connect it to the right systems and arrange access, review and monitoring. Result: an application that becomes part of the day-to-day process.
A model cannot repair missing information, unclear responsibilities or a broken process.
The information you need is often spread across documents, an ERP, a CRM and individual files. That is why we also look at how those sources connect. Sometimes ordinary automation is enough. Sometimes information needs to be brought together first.
That is not a preliminary project hidden behind an AI label. It is part of the answer. We will also tell you when a simpler solution is the better fit.
What we work through together during an initial conversation.
It could use documents, emails, ERP or CRM records, reporting data and other sources you already rely on. We first check whether the content is usable and accessible.
No. We do need to determine which information is reliable enough for the chosen task. If the source or process needs attention first, we make that clear.
If the rules are fixed and the input is predictable, AI is often unnecessary. We use AI when an application needs to interpret language, documents, patterns or changing context.
For each process, we agree what may happen automatically and when someone needs to review or approve the result. That boundary depends on the risk and the way your team works.
Bring us one process. We will look at the available information, where decisions are getting stuck and whether AI can genuinely help.
Discuss your use case
The June 2026 Power BI Desktop Bridge lets an agent build and verify reports. Here is how to enable it and install the two CLIs the docs leave out.
Read
AI won’t make people jobless. It will change how we work and create new kinds of jobs. See what history teaches us about how technology reshapes work.
Read
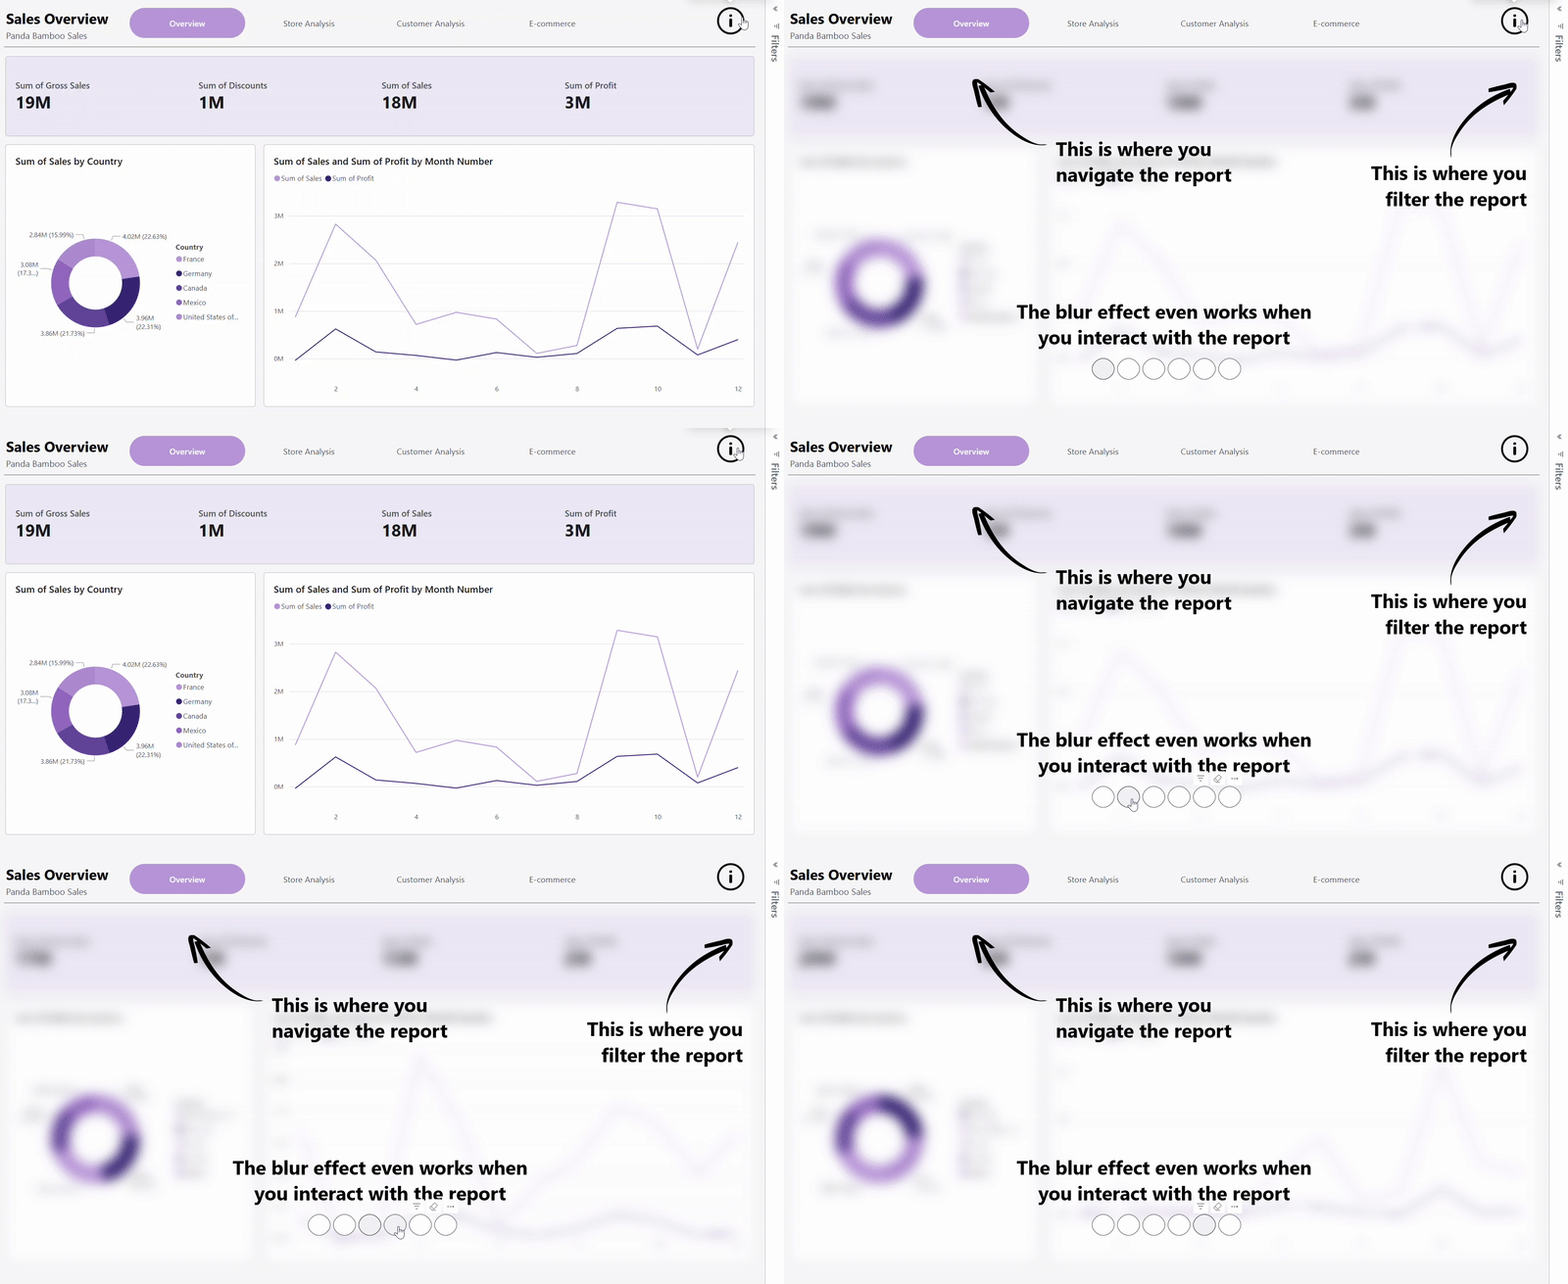
Learn how to add a blur effect to your Power BI reports using a simple HTML trick. Guide your users’ attention, create interactive overlays, and make your reports easier to navigate with this practical step-by-step tutorial.
Read