
power bi
Version control for Power BI
Simple guide to set up version control for Power BI using PBIP, Git and clean repo structures. Learn branching, deployme...
ReadThe June 2026 Power BI Desktop Bridge lets an agent build and verify reports. Here is how to enable it and install the two CLIs the docs leave out.
The June 2026 Power BI update lets an AI agent change a report and see the result in a running Power BI Desktop session, then correct itself and try again. The feature that opens that door is the Desktop Bridge.
If you go hunting for "Desktop Bridge" in Preview Features, though, you will not find it. The setting is there, sitting under a name that never mentions the feature, and the two command-line tools that make the whole thing run are missing from the feature page entirely.
So here is the full setup, in order. What shipped, what the Bridge actually does, and the exact toggle and CLIs you need to be developing reports with an agent by this afternoon.
The June 2026 release (version 2.155.756.0) is the one where several preview pieces finally line up into something you can call agent-driven development. The headline items are the Power BI Desktop Bridge, the AI-powered report authoring agent skills in Skills for Fabric, and Copilot in web modeling, which applies renames, relationships, and DAX measures from natural-language prompts, all in preview. DAX user-defined functions went generally available in the same release, and the PBIR report format continues its default-on rollout in the service.
Most of the attention goes to the Copilot features, because they live inside Microsoft's own surfaces and need no setup. The Bridge is the quieter one, and it is the keystone for anyone building their own agent workflow. It is the piece that lets a tool you control reach into Power BI Desktop while it is open.
The Desktop Bridge is a small local server hosted inside the Power BI Desktop process. It lets an external tool talk to a running Desktop session on the same machine. Each open Desktop window publishes its own channel, a named pipe called pbi-desktop-bridge-${processId}, so a client picks which window it wants to drive. A named pipe is a local-only connection: there is no network port, no remote access, and no REST endpoint. Communication runs over JSON-RPC 2.0, and only one operation can run at a time, so a client waits for the current call to finish before sending the next.
The first call you make is bridge.manifest. It returns the methods that your version of Desktop supports, and since that set changes between releases, it is the right way to check what the Bridge can do before you call anything else. What this gives you in practice is a loop: read the current report definition, apply a change, capture a screenshot of the result, and go again. That loop is the whole point.
Until now, an agent could write Power BI report files. It could emit the PBIR JSON that defines pages, visuals, and layout. What it could not do was look at the result. It generated and hoped.
The Bridge closes that gap. An agent applies a change, renders it in the live session, sees the screenshot, and corrects itself when a visual lands in the wrong place or a layout breaks. That feedback loop is what separates a tool that drafts report files from one that actually builds a report you would ship. The report authoring skills in Skills for Fabric are built on exactly this: they plan, design, author, validate, and publish through natural-language prompts, with the validation step driven by the Bridge. Because the report layer is plain PBIR underneath (the JSON behind a .pbip project), the changes are also diff-friendly in source control, so a teammate can review them the way they review code.
You need the June 2026 build of Power BI Desktop, version 2.155.756.0 or later. The Bridge is on by default, but you will want to confirm it, and this is where people get stuck.
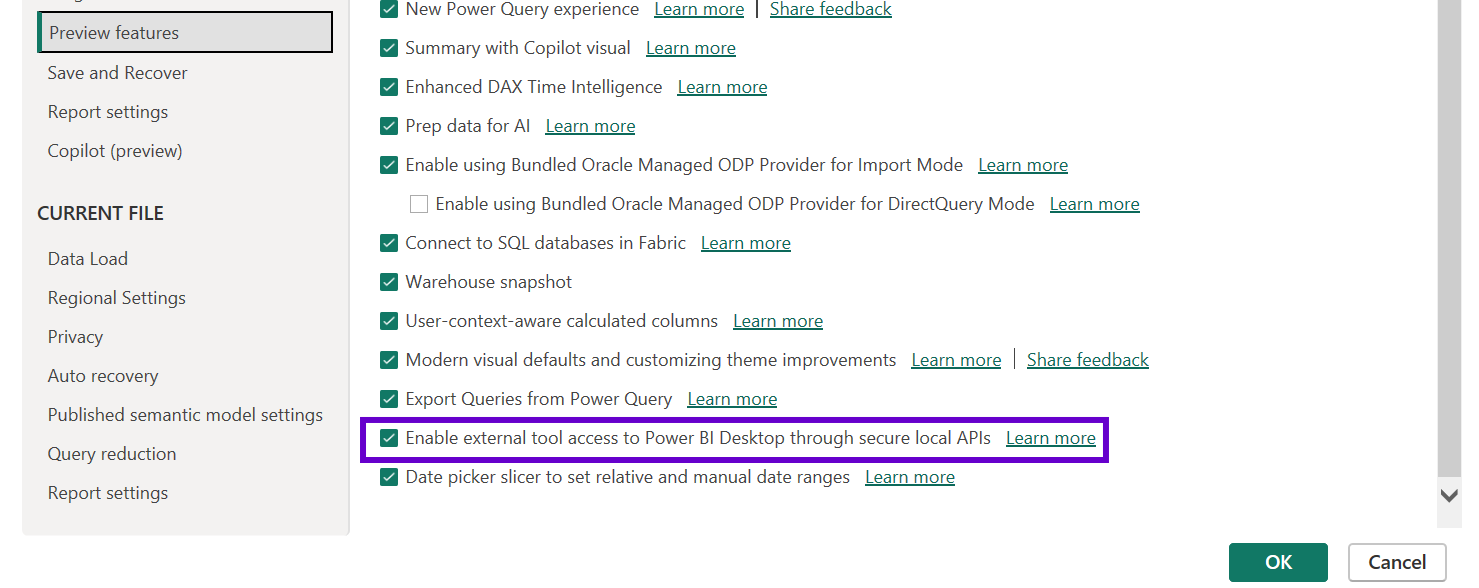
Open Power BI Desktop, go to File, then Options and Settings, then Options, then Preview Features. The checkbox you are looking for is Enable external tool access to Power BI Desktop through secure local APIs. That is the Desktop Bridge. The words "Desktop Bridge" do not appear next to it, which is why searching the list for them turns up nothing. Tick it, confirm, and restart Desktop if it asks you to.
The Bridge endpoint is raw JSON-RPC over a named pipe. You need a client to speak to it, and this is the part the feature pages do not cover. Two command-line tools do the work, both published by Microsoft as npm packages, so you need Node.js installed first.
@microsoft/powerbi-desktop-bridge-cli, command powerbi-desktop. This is the Bridge client. It finds your running Desktop instances, connects to the right named pipe, calls bridge.manifest to discover the available methods, and invokes them. It is the transport layer between your agent and the live session.
@microsoft/powerbi-report-authoring-cli, command powerbi-report-author. This is the report-authoring toolkit that sits on top of the Bridge. It plans, generates, and validates the report layer against your local PBIP and PBIR files and the running session, then publishes. It is what the report authoring agent skills call under the hood.
Install both globally with npm. One caution worth stating plainly: these are new preview packages, and the exact install command, flags, and version pinning are thinly documented right now, so check each package README before you run anything rather than trusting a command you copied. One more trap: there is an older, unrelated npm package called powerbi-report-authoring, a browser embedding library. It is not the CLI, and it will not help you here. Make sure you are installing the @microsoft/...-cli packages.
These CLIs are half of the picture. The other half is the model. Microsoft's powerbi-modeling-mcp server exposes the semantic model, the tables, columns, measures, relationships, and DAX, as tools an agent can call directly, so it can create a measure or fix a relationship without you clicking through Desktop.
The division is clean and worth holding onto. The MCP server builds and edits the model. The report side, the pages, visuals, and layout, runs through the Desktop Bridge and the report-authoring CLI, which is also where the rendering and verification happen. Run them together and an agent can take a request from an empty model to a rendered, checked report. The pieces ship from different places, and the documentation that ties them together is exactly what is missing, which is the gap this guide is here to fill.
If you want to see the loop work this afternoon, the sequence is short. Update Power BI Desktop to the June 2026 release. Open File, Options and Settings, Options, Preview Features, and confirm "Enable external tool access to Power BI Desktop through secure local APIs" is ticked. Install Node.js if you do not have it, then add the two CLIs, powerbi-desktop and powerbi-report-author, checking each package README for the exact command. Open a report, run the Bridge client's discovery call to confirm Desktop answers, then point your agent or the report-authoring skill at the session and keep the MCP server in the setup for the model side. It is preview, so the method surface will shift between Desktop versions. Re-run bridge.manifest after every update and you will always know what the Bridge can do that day.
More pieces from the field on the same topic.
Simple guide to set up version control for Power BI using PBIP, Git and clean repo structures. Learn branching, deployme...
Read
Speed up CSV imports in Power Query by turning off automatic type detection and defining column types at the end.
Read
What's the difference between Power Bi and Microsoft Fabric? Power Bi is best for data vizualisation and reporting. Fabr...
ReadA no-strings advisory call. We'll tell you honestly what's realistic, or point you elsewhere.
Book a discovery call