Data observability
What is data observability?
Data observability is continuous monitoring of the health of your data. It checks whether tables are fresh, row counts look normal, schemas have stayed stable, values behave as expected, and downstream reports or models are affected.
The term was popularised by Barr Moses and Monte Carlo around the same idea as software observability. Tools such as Datadog or New Relic watch applications. Data observability watches the data those applications and analytics workflows produce.
The gap matters because a pipeline can be green while the data is wrong. A job ran. A table exists. A dashboard opens. Yet the newest rows may be missing, a source schema may have changed, or a value distribution may have shifted enough to make the report misleading.
The five pillars
The most common framework uses five signals.
Freshness. Did the data arrive on time? A table that should refresh hourly but has not changed for eighteen hours is stale.
Volume. Did the expected number of rows arrive? A daily import that usually has 10,000 rows but suddenly has 200 needs attention.
Schema. Did columns, types, nullability, or nested structures change? One renamed source field can break many dashboards.
Distribution. Do values still look normal? Watch null rates, ranges, averages, category mix, and outliers.
Lineage. Which sources, tables, models, and dashboards are connected? Lineage tells you what is affected when an incident happens.
A good observability setup does not treat every table equally. It focuses first on production datasets that feed decisions, customers, finance, operations, AI systems, or executive reporting.
Observability versus data tests
Data tests check rules you already know. In dbt, common tests include not_null, unique, accepted_values, and relationships. Examples: customer_id must not be null, order_id must be unique, status must be one of five accepted values.
Observability catches patterns you did not explicitly write as rules. A table usually receives 30,000 rows on Mondays but receives 300 today. A numeric column suddenly has a different distribution. A source arrives two hours late. A new upstream column appears.
Both are useful. Tests are cheap and precise for known expectations. Observability is broader and better at finding unexpected changes.
Observability versus pipeline monitoring
Pipeline monitoring tells you whether the job ran. Airflow, Dagster, Fabric Data Pipelines, Azure Data Factory, and similar tools can show task status, retries, logs, and runtime.
Data observability tells you whether the output is still trustworthy.
You need both. If a pipeline fails, the orchestrator should alert. If a pipeline succeeds but loads zero useful rows, observability should alert.
Examples
Stale dashboard
A sales dashboard opens every morning, but the source table stopped receiving new orders three days ago. Freshness monitoring catches the stale table before the sales meeting uses old numbers.
Unexpected volume
A marketing events table normally receives 100,000 events per day. Today it receives 2 million because a source started duplicating events. A volume monitor catches the spike.
Silent schema change
An API renames total_amount to amount_total. The load still runs, but downstream revenue becomes null. Schema monitoring catches the upstream change quickly.
Distribution shift
A discount field normally sits between 0 and 30 percent. Overnight, half the rows have 100 percent discount. Distribution monitoring raises the flag.
What to watch out for
Alert fatigue
The first weeks can be noisy. Tune thresholds and routing so alerts reach the owner and represent real risk.
Cold-start baselines
Anomaly detection needs history. New tables often generate more false positives until a normal pattern is learned.
No owner, no response
An alert in a channel nobody owns is just background noise. Assign owners to critical datasets.
Observability does not replace contracts
Use data contracts for expectations with upstream producers. Use tests for known rules. Use observability for the wider health signals around them.
Cost control
Some platforms charge by table, column, volume, or warehouse usage. Start with critical production tables before monitoring every scratch table.
Keywords
data observability
data quality
data monitoring
freshness
volume
schema
distribution
lineage
monte carlo
dbt tests
data pipeline
From the blog.
More pieces from the field on the same topic.
New Data Panda connectors in June 2026
Seven new Data Panda connectors from June 2026, with practical reporting ideas for stock, finance, ticketing, route planning and operations.
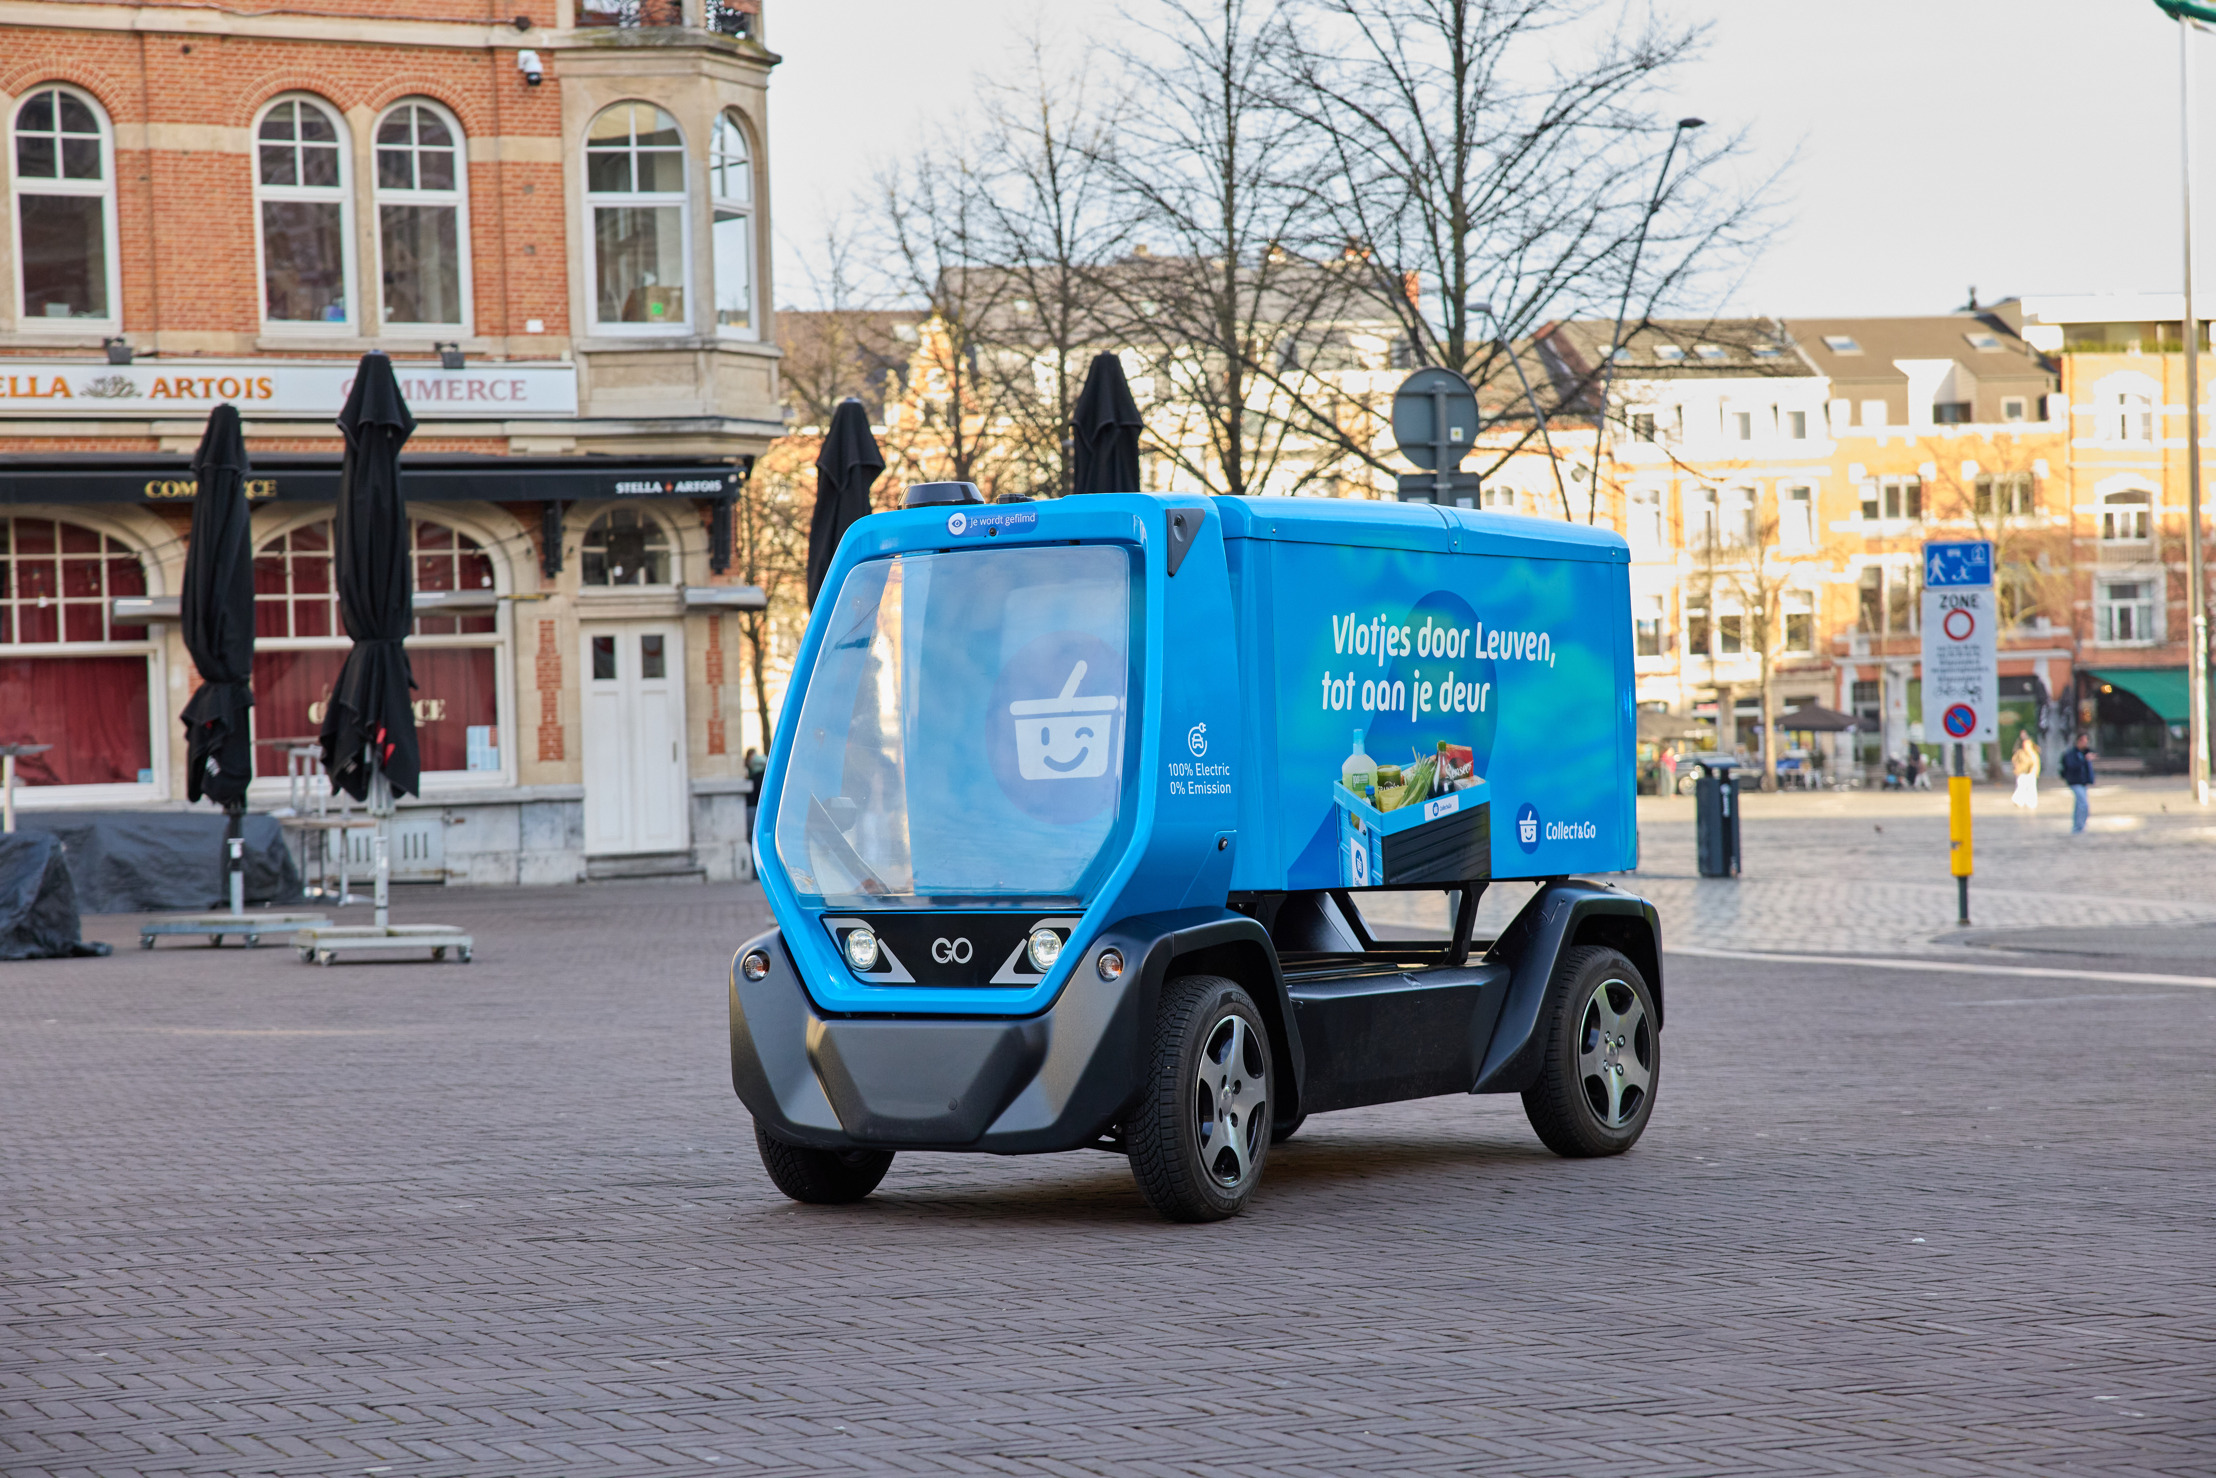
Collect&Go rolls out a driverless grocery cart in Leuven
Collect&Go and Telenet Business are testing an autonomous electric delivery cart in Leuven, steered over 5G. What it means for logistics and...