
Data integration
New Data Panda connectors in August 2026
Seven new Data Panda connectors from August 2026: ECB rates, ProfitPlus Webshop, SAP S/4HANA, Exact Venice, OpusFlow, AB...
ReadSeven new Data Panda connectors from July 2026, with practical applications for inspections, cash flow, planning, projects, equipment and site administration.
In July 2026, we added seven Data Panda connectors: Vinçotte, Tide, Visual Planning, EazyProject, Hilti ON!Track, Conneqtr and Timely.
They bring inspection, banking, planning, project, equipment, site-administration and time-tracking data into the same place. Here is what you can do with each source in practice.
Vinçotte Connect brings together inspection jobs, assets, reports and invoices. In businesses with installations, machinery or construction projects, that information often sits apart from maintenance, procurement and finance.
Bring those data together and you can track upcoming inspections, recurring non-conformities, assets that need the most follow-up and the costs attached to controls. Connect the asset ID to your maintenance or ERP system too. Otherwise, it remains difficult to link an inspection report to the right installation.
Tide brings together business accounts, transactions, cards and invoices. For teams that still reconstruct cash flow from bank exports and accounting totals, that is a clear first use case.
Put bank transactions next to outstanding invoices, sales and costs. You can then see sooner which payments are coming in, where money is going and which expenses deviate from the usual pattern. First set rules for transfers between your own accounts and reimbursements. You do not want to report those as revenue or costs.
Visual Planning covers resources, schedules, events and projects. It tells you who is planned where and when. To see the full picture, you also need actual hours, sales, invoicing and costs.
With planning data in your warehouse, you can compare utilisation with booked hours, connect projects to their margin and see where capacity is idle or too tight. Agree beforehand what a resource, event and project mean. Without that, a central overview quickly becomes another discussion.
EazyProject brings together projects, time, resources and invoicing for professional-services companies. It makes the step from planned work to genuinely billable hours much easier to see.
You can track project margin, non-billable hours, team utilisation and budget variances. Add your accounting data, and you can see whether a project that looks healthy operationally is actually profitable. Start with one fixed definition of billable time. Otherwise, every utilisation percentage remains open to debate.
Hilti ON!Track registers tools, equipment, consumables, locations and maintenance. It is especially useful when materials move between warehouses, sites and crews.
Next to project and cost data, you can see which equipment is idle, moved often, due for maintenance or disproportionately expensive on a site. Make sure location and project codes match those in your other systems. That prevents one site from having a different name in every application.
Conneqtr supports the Belgian construction sector with site administration: access, attendance, compliance, delivery notes and order-to-invoice workflows. Those data are usually spread across different screens and people.
In a data layer, you can connect attendance to project costs, track compliance status for site access and put delivery notes next to purchasing or invoicing. Keep registered attendance and productive time separate, though. Both matter, but they do not mean the same thing.
Timely records time, projects, clients, budgets and capacity. For professional-services companies, it is often the source for answering where hours go. Without a connection to sales and finance, part of the story is still missing.
You can compare capacity with planning, monitor project budgets, track billable time and see which clients or projects put pressure on margin. Ask people to book time against a limited, stable set of project and activity codes. Too much free text mostly creates clean-up work later.
A connector is not the end point. Pick one question that currently costs your team time every week.
That question also helps you settle the definitions: what is a project, asset, hour, site or cost? That work determines whether a report is useful in the end.
We usually start with one source, one question and one report or check. First, we land the raw data. Then we agree on the definitions. Only then do we build the dashboard, workflow or internal app.
This lets you check early whether the numbers are right, without spending months on a data model nobody uses. If you use one of these systems and want to decide where to start, we are happy to take a look with you.
More pieces from the field on the same topic.
Seven new Data Panda connectors from August 2026: ECB rates, ProfitPlus Webshop, SAP S/4HANA, Exact Venice, OpusFlow, AB...
Read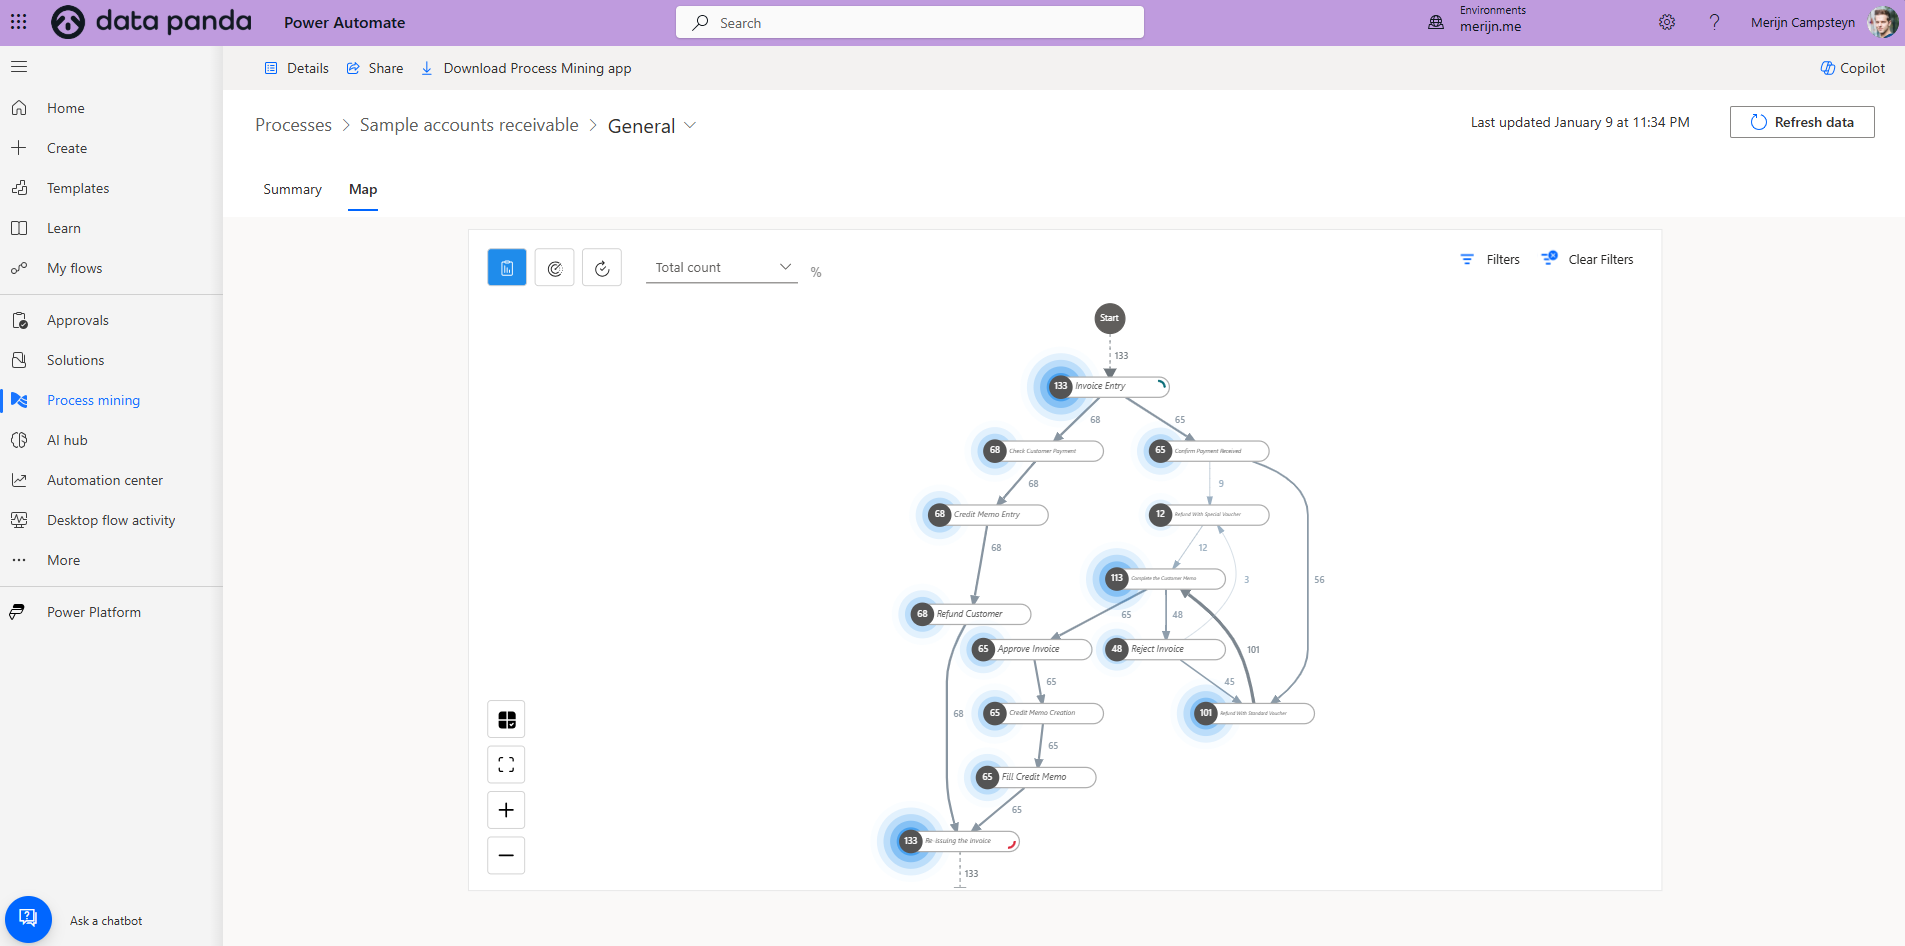
Learn how to leverage Microsoft Power Automate’s process mining module for efficient process automation and actionable i...
Read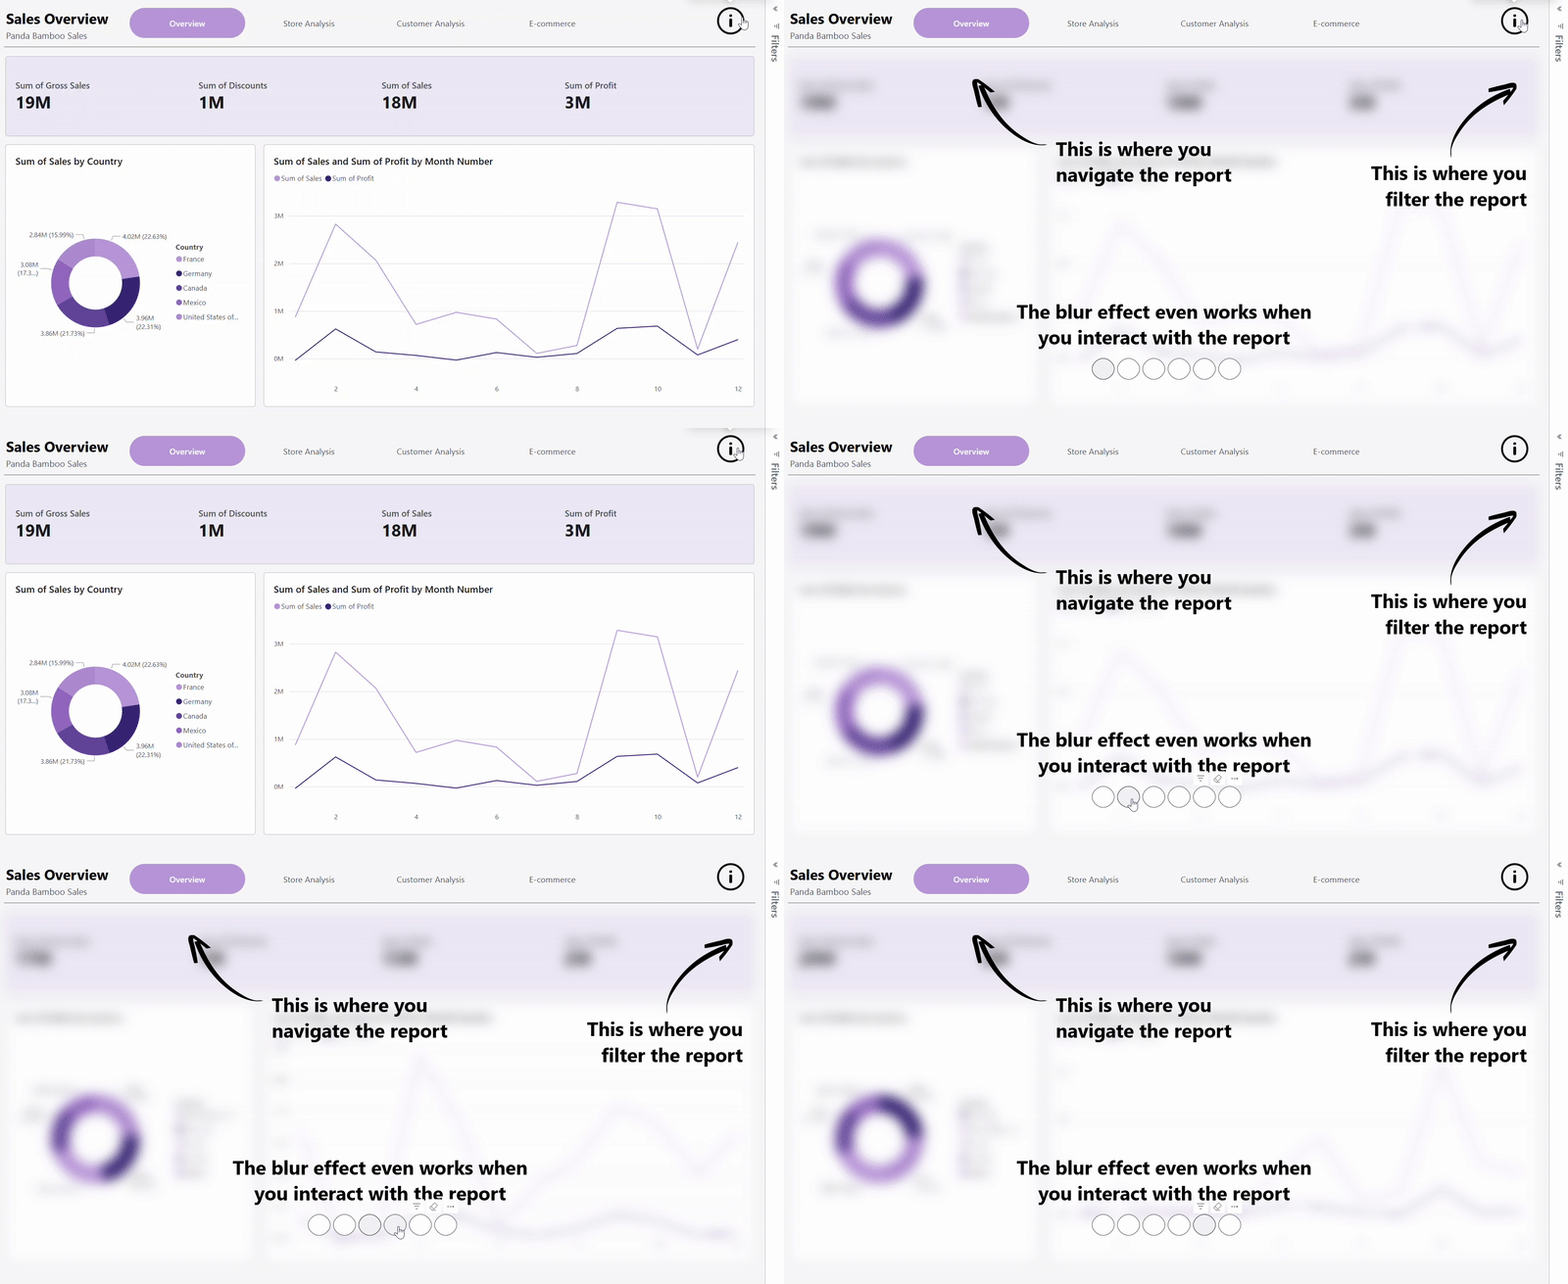
Learn how to add a blur effect to your Power BI reports using a simple HTML trick. Guide your users’ attention, create i...
ReadA no-strings advisory call. We'll tell you honestly what's realistic, or point you elsewhere.
Book a discovery call