Data Dictionary
Calculation group
What is a calculation group?
A calculation group is a table in your semantic model that reshapes existing DAX measures with a single click. Instead of writing a YTD, QTD and YoY variant for each measure, you write that pattern once and let Power BI apply it automatically to every measure that ends up in a visual.
A calculation group is made up of calculation items. Each item is a DAX expression with a placeholder, SELECTEDMEASURE(), that refers to the measure currently in view. Add an item "YTD" with the expression CALCULATE(SELECTEDMEASURE(), DATESYTD('Date'[Date])), and you get the YTD variant of Revenue, Margin, Order Count and every other measure in the model, all in one go.
Calculation groups are supported in Power BI, Microsoft Fabric Premium semantic models, Azure Analysis Services and SQL Server Analysis Services from 2019 onwards (compatibility level 1500 or higher). The authoring experience has been built into Power BI Desktop for several versions now.
Which problem do they solve?
Without calculation groups, tabular models often spin out of control.
Say you have ten measures: revenue, gross margin, order count, average order size, retention and so on. Your product manager asks for a YTD, MTD, QTD, Previous Year and YoY% variant of each. That is fifty extra measures in one afternoon, all with the same DAX pattern. Six months later nobody knows which variant has been kept up to date, and the model is full of duplicates.
A calculation group "Time calculation" with five items (Current, YTD, MTD, QTD, PY, YoY%) does the same work for every measure, including ones you add next month. The user drops a slicer from the calculation group next to the measure and picks the variant.
How does a calculation group work?
The SELECTEDMEASURE() placeholder
This is the key. The item does not spell out a concrete measure; it describes a transformation applied to whatever measure is in the visual.
Calculation items as rows in a table
In a report, the calculation group shows up as a column with the names of the items (Current, YTD, MTD). Put that column in a matrix and you get one column per item, each holding the value of the transformation applied to the measure.
Dynamic format strings
An item can force its own format string. Handy for currency conversion, or for a YoY% item that should always display as a percentage no matter the underlying measure.
DiscourageImplicitMeasures
Calculation groups only work with explicit measures. Power BI has to be configured to discourage implicit measures (dragging a numeric column straight onto a visual). This property is set to true automatically the moment you add a calculation group.
When do you use a calculation group?
Time intelligence across a whole model. The classic example: YTD, MTD, QTD, previous year, YoY%, YoY absolute. Without a calculation group you end up with hundreds of redundant measures.
Currency conversion. One item per target currency (EUR, USD, GBP) that multiplies the selected measure by the exchange rate on the invoice date. Dynamic format strings set the right currency symbol automatically.
What-if and scenario analysis. Items like "Base", "Optimistic +10%", "Pessimistic -15%" that apply a multiplier to every measure.
Unit switching. One item for kilograms, one for pounds, one for metric tons. The user picks the unit and every number in the visual follows.
Ranking and comparisons. Items like "Rank in sector", "Percentile" or "Deviation from average" applied to every selected measure.
Precedence with multiple groups
If you have two calculation groups in the same model, say "Time calculation" and "Averages", Power BI has to know the order in which to combine them. That is what the precedence property is for.
The group with the higher precedence is applied first, and then SELECTEDMEASURE() inside that expression is replaced by the expression of the next group. Classic example: "YTD of daily average" should not give the same answer as "daily average of YTD". By giving Time calculation a higher precedence (say 20) than Averages (10), YTD applies to the full daily-average fraction, not only to the numerator.
It is tempting to stack several groups, but every extra group makes the model harder to reason about. Rule of thumb: no more than two or three calculation groups per model.
Pitfalls
No row-level security on the calculation group itself
RLS is not supported on calculation groups. Always enforce access through role rules on the fact and dimension tables, never on the calculation group directly.
Implicit measures disappear
The moment a calculation group is in the model, a report author can no longer drag a numeric column straight onto a visual. Every measure has to be defined explicitly. For teams used to pulling "Sale Price" onto a visual on the fly, that initially feels strict.
Data types become variant
Once a calculation group exists, measures report the type variant. Existing dynamic format strings that counted on the original type can then throw errors. Use FORMAT() to cast explicitly.
Not compatible with Smart Narrative and Detail Rows
Several Power BI features do not work with calculation groups. Anyone who builds a lot with Detail Rows Expressions or Smart Narrative has to keep that in mind.
One item at a time in the filter context
A calculation item only applies when exactly one item is selected. Filtering two items at once either gives an empty result or an explicit multipleOrEmptySelectionExpression that you write yourself.
Keywords
calculation group
calculation item
dax
power bi
semantic model
tabular model
time intelligence
selectedmeasure
analysis services
microsoft fabric
/ Further reading
From the blog.
More pieces from the field on the same topic.
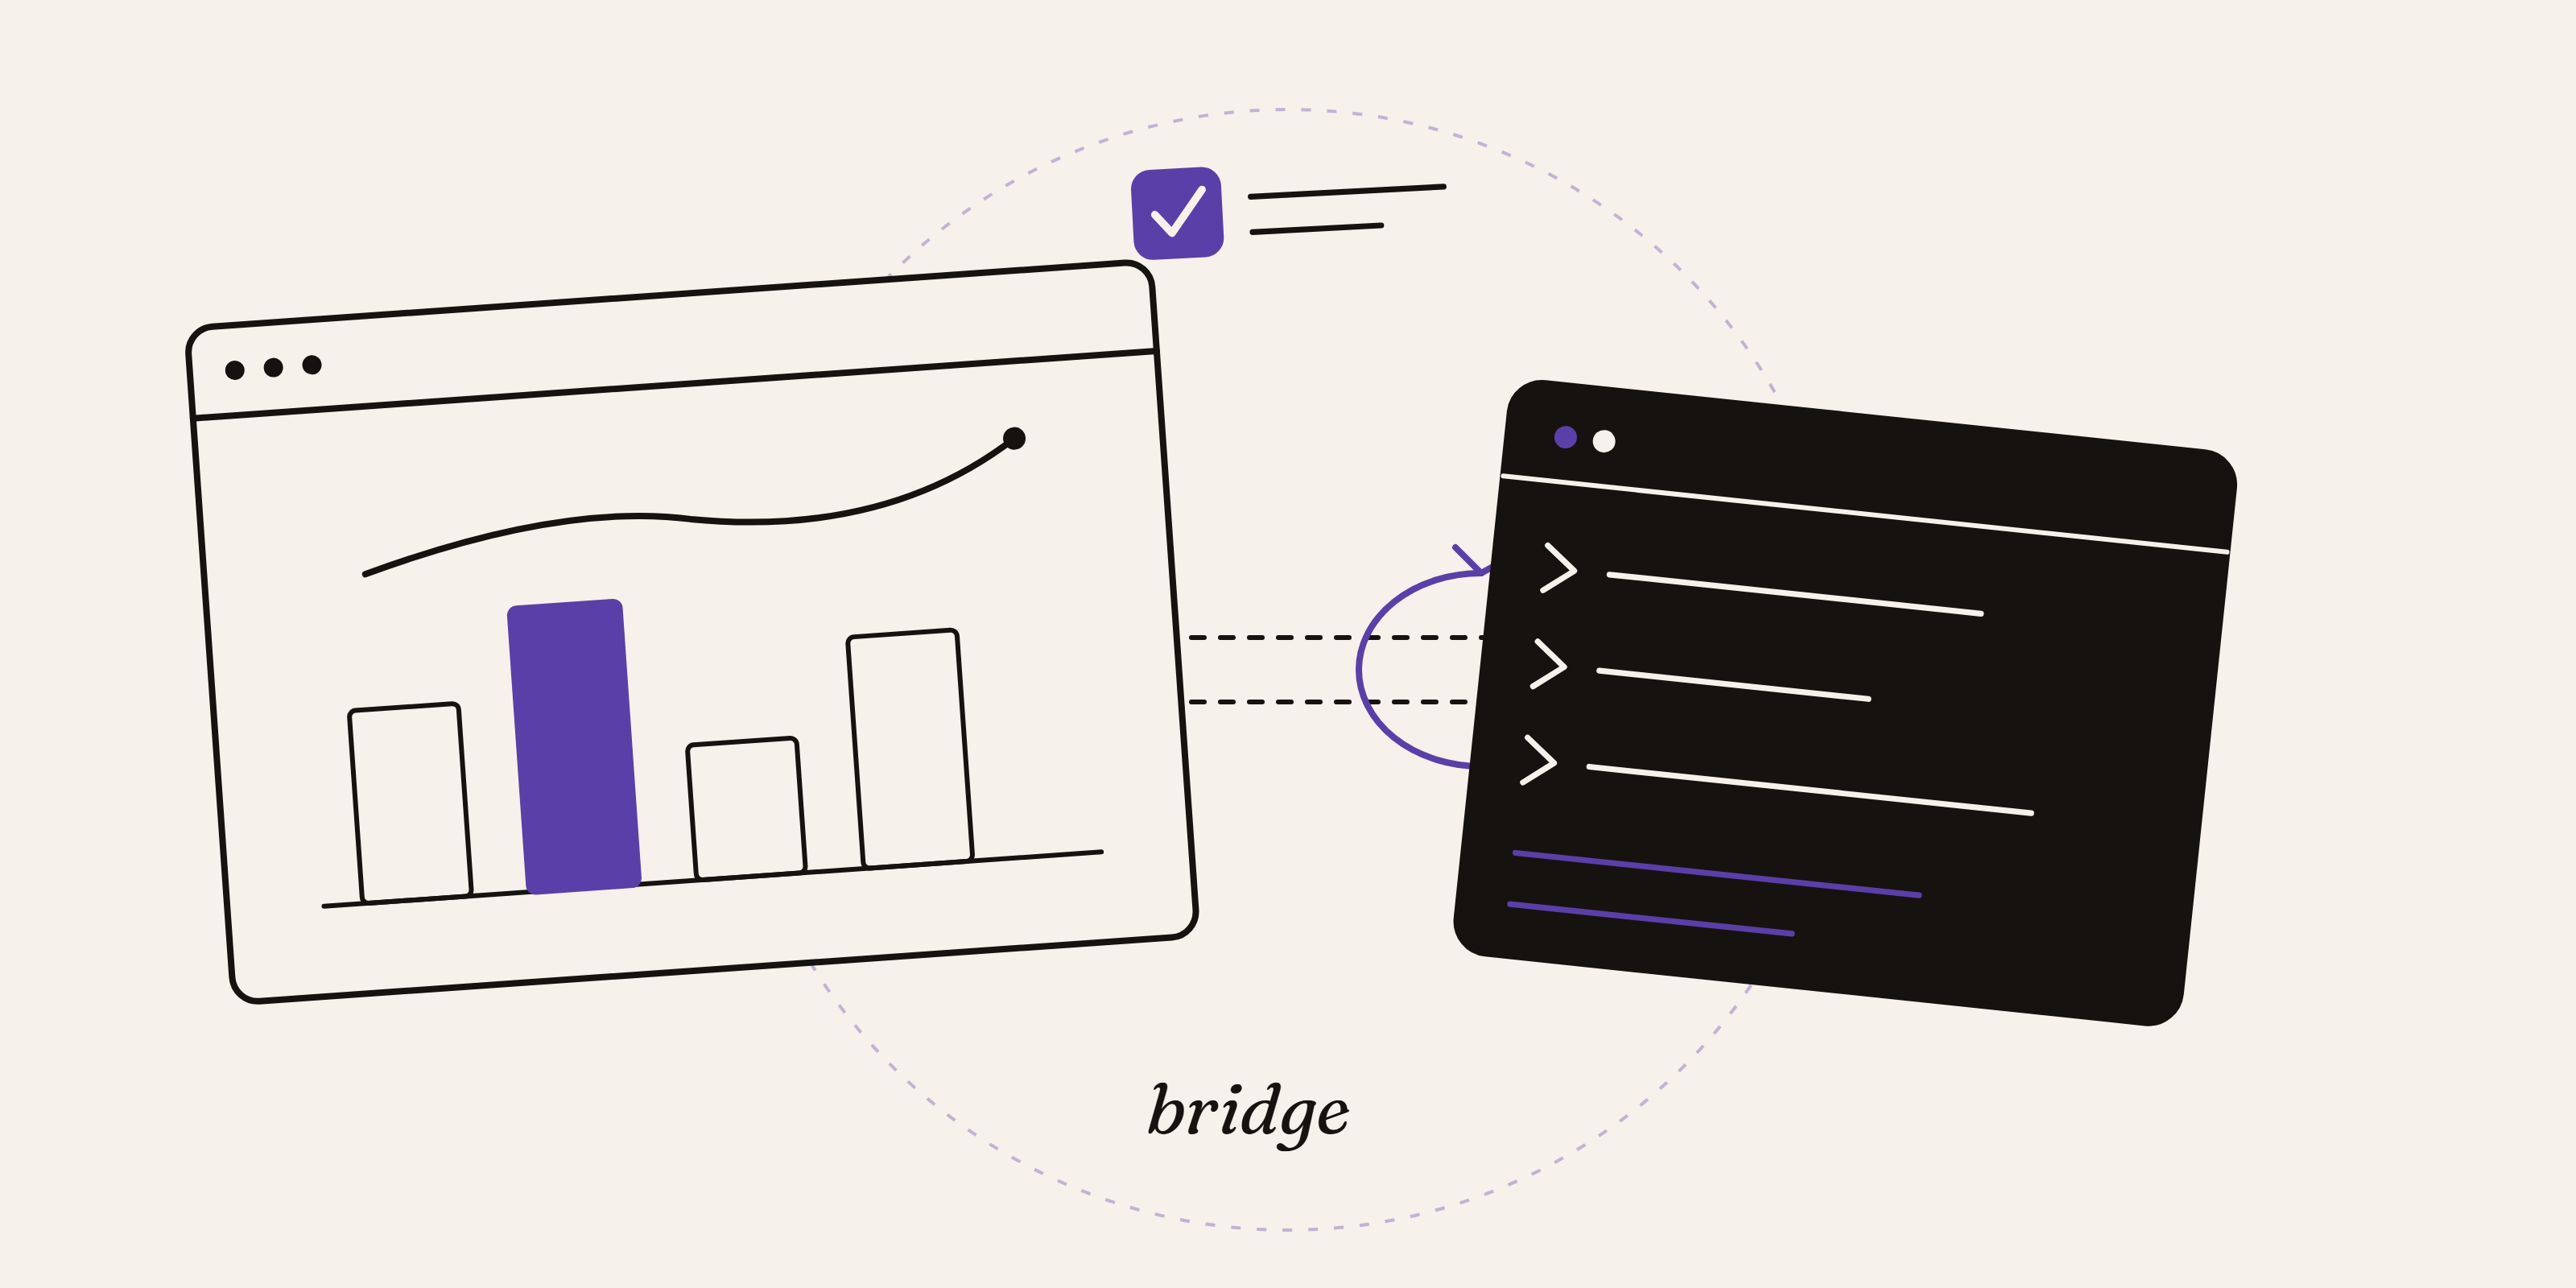
How to enable the Power BI Desktop Bridge (and the CLIs the docs leave out)
The June 2026 Power BI Desktop Bridge lets an agent build and verify reports. Here is how to enable it and install the two CLIs the docs lea...
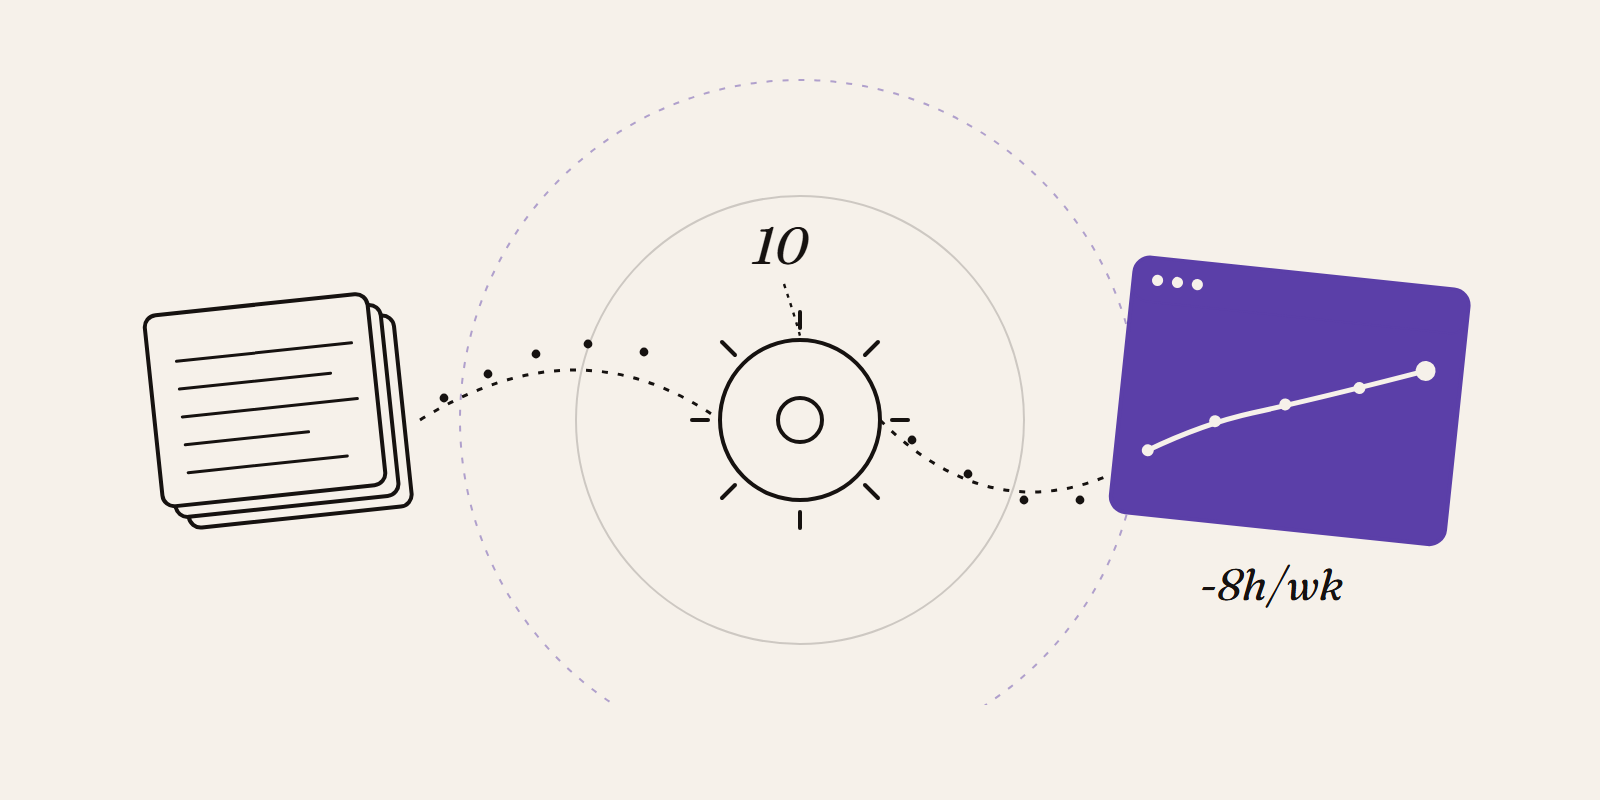
10 Practical Steps to Automate Your Business Processes
Ten practical steps to automate your business processes without AI hype. Start small, fix the process first, use the tools you already own, ...