Data Dictionary
Power Bi
What is Power BI?
Power BI is a business intelligence and data visualisation tool created by Microsoft. It allows people to connect to data from many different sources, such as Excel files, databases, cloud services, or even accounting and sales systems. Once the data is connected, Power BI helps you clean, combine, and visualise it so that it becomes easy to understand.
With Power BI, you can build interactive dashboards and reports that show how your business is performing. You can explore trends, compare results, and find out what is working well and what needs attention. Because the dashboards update automatically, you always have the latest figures at hand without having to rebuild your reports each time.
Power BI can be used by anyone in a company, from managers who want an overview of the business, to analysts who want to explore data in detail. It brings data together in one place and turns it into insights that help you make better decisions, faster. The tool can cater both for expert data analysts but is at the same time accessible enough for business users without a lot of technical knowledge.
Components of Power BI
Power BI Desktop
This is the program you install on your computer. It is where you build reports. You can connect to data, clean it, and design visuals such as charts or tables. When your report is ready, you can publish it online for others to use.
Power BI Service
This is the online version that runs in the cloud. It lets you share your reports and dashboards with your team. The data can refresh automatically, so your dashboards always show the most recent numbers.
Power BI Mobile
Power BI also has apps for phones and tablets. They allow you to view and interact with your dashboards wherever you are.
Power BI Report Server
Some organisations prefer to keep their data inside their own network instead of the cloud. Power BI Report Server allows them to store and share reports on their own servers.
Paginated Reports
These are special reports made for printing or exporting, for example invoices or monthly summaries. They are designed to fit neatly on a page, unlike interactive dashboards.
Power BI and Microsoft Fabric
Microsoft recently introduced Microsoft Fabric, a platform that brings all data and analytics tools together in one place. Power BI is an important part of it.
In Fabric, all data is stored in a central location called OneLake. Power BI connects directly to this data, so you can create dashboards and reports without having to copy or move the data first. This makes the process faster and simpler.
In short, Power BI is the visual layer of Microsoft’s data ecosystem. It turns stored data into easy-to-read insights that help people understand what is happening in their business.
Frequently Asked Questions (FAQ)
1. Do I need programming skills to use Power BI?
No. Power BI is designed for business users. Most tasks such as creating visuals, filtering data, and building dashboards can be done with simple drag-and-drop actions. More advanced users can use formulas in DAX (Data Analysis Expressions) for deeper analysis. Loading and transforming data is done with Power Query in the M language. Understanding programming or scripting definitely helps but Power Bi also provides a visual interface that allows you to create complex actions without any hands-on coding.
2. Is Power BI free to use?
Yes, Power BI Desktop is free to download. However, if you want to share your dashboards online or collaborate with others, you need a Power BI Pro or Premium license. Enterprise clients can also look into Premium or Fabric capacity.
3. What kind of data can Power BI connect to?
Power BI can connect to almost any data source: Excel files, SQL databases, SharePoint, Google Analytics, ERP systems, cloud platforms, and many more. Power Bi has hundreds of pre-built connectors for various data sources.
4. Can Power BI update data automatically?
Yes. You can schedule automatic data refreshes in Power BI Service so your dashboards always show up-to-date numbers.
5. What is the difference between Power BI and Excel?
Excel is great for calculations and small datasets, while Power BI is built for analysing large volumes of data, connecting multiple sources, and creating interactive dashboards that can be shared easily.
6. Can I use Power BI on my phone or tablet?
Yes. The Power BI mobile app allows you to view and interact with reports and dashboards anywhere.
7. Is Power BI safe for company data?
Yes. Power BI follows Microsoft’s enterprise-grade security standards. You can manage user access, encryption, and data storage policies. If you're already in the Microsoft ecosystem Power Bi is an excellent choice for data analysis and reporting.
8. How does Power BI fit into Microsoft Fabric?
Power BI is the visualisation and reporting layer of Microsoft Fabric. It works directly with data stored in Fabric’s OneLake and helps users turn that data into insights.
9. Can I print or export Power BI reports?
Yes. You can export dashboards to PDF or use paginated reports for print-friendly formats.
Keywords
Power BI
Microsoft Power BI
business intelligence
data visualization
dashboards
reports
data analysis
Power BI Desktop
Power BI Service
Microsoft Fabric
/ Further reading
From the blog.
More pieces from the field on the same topic.
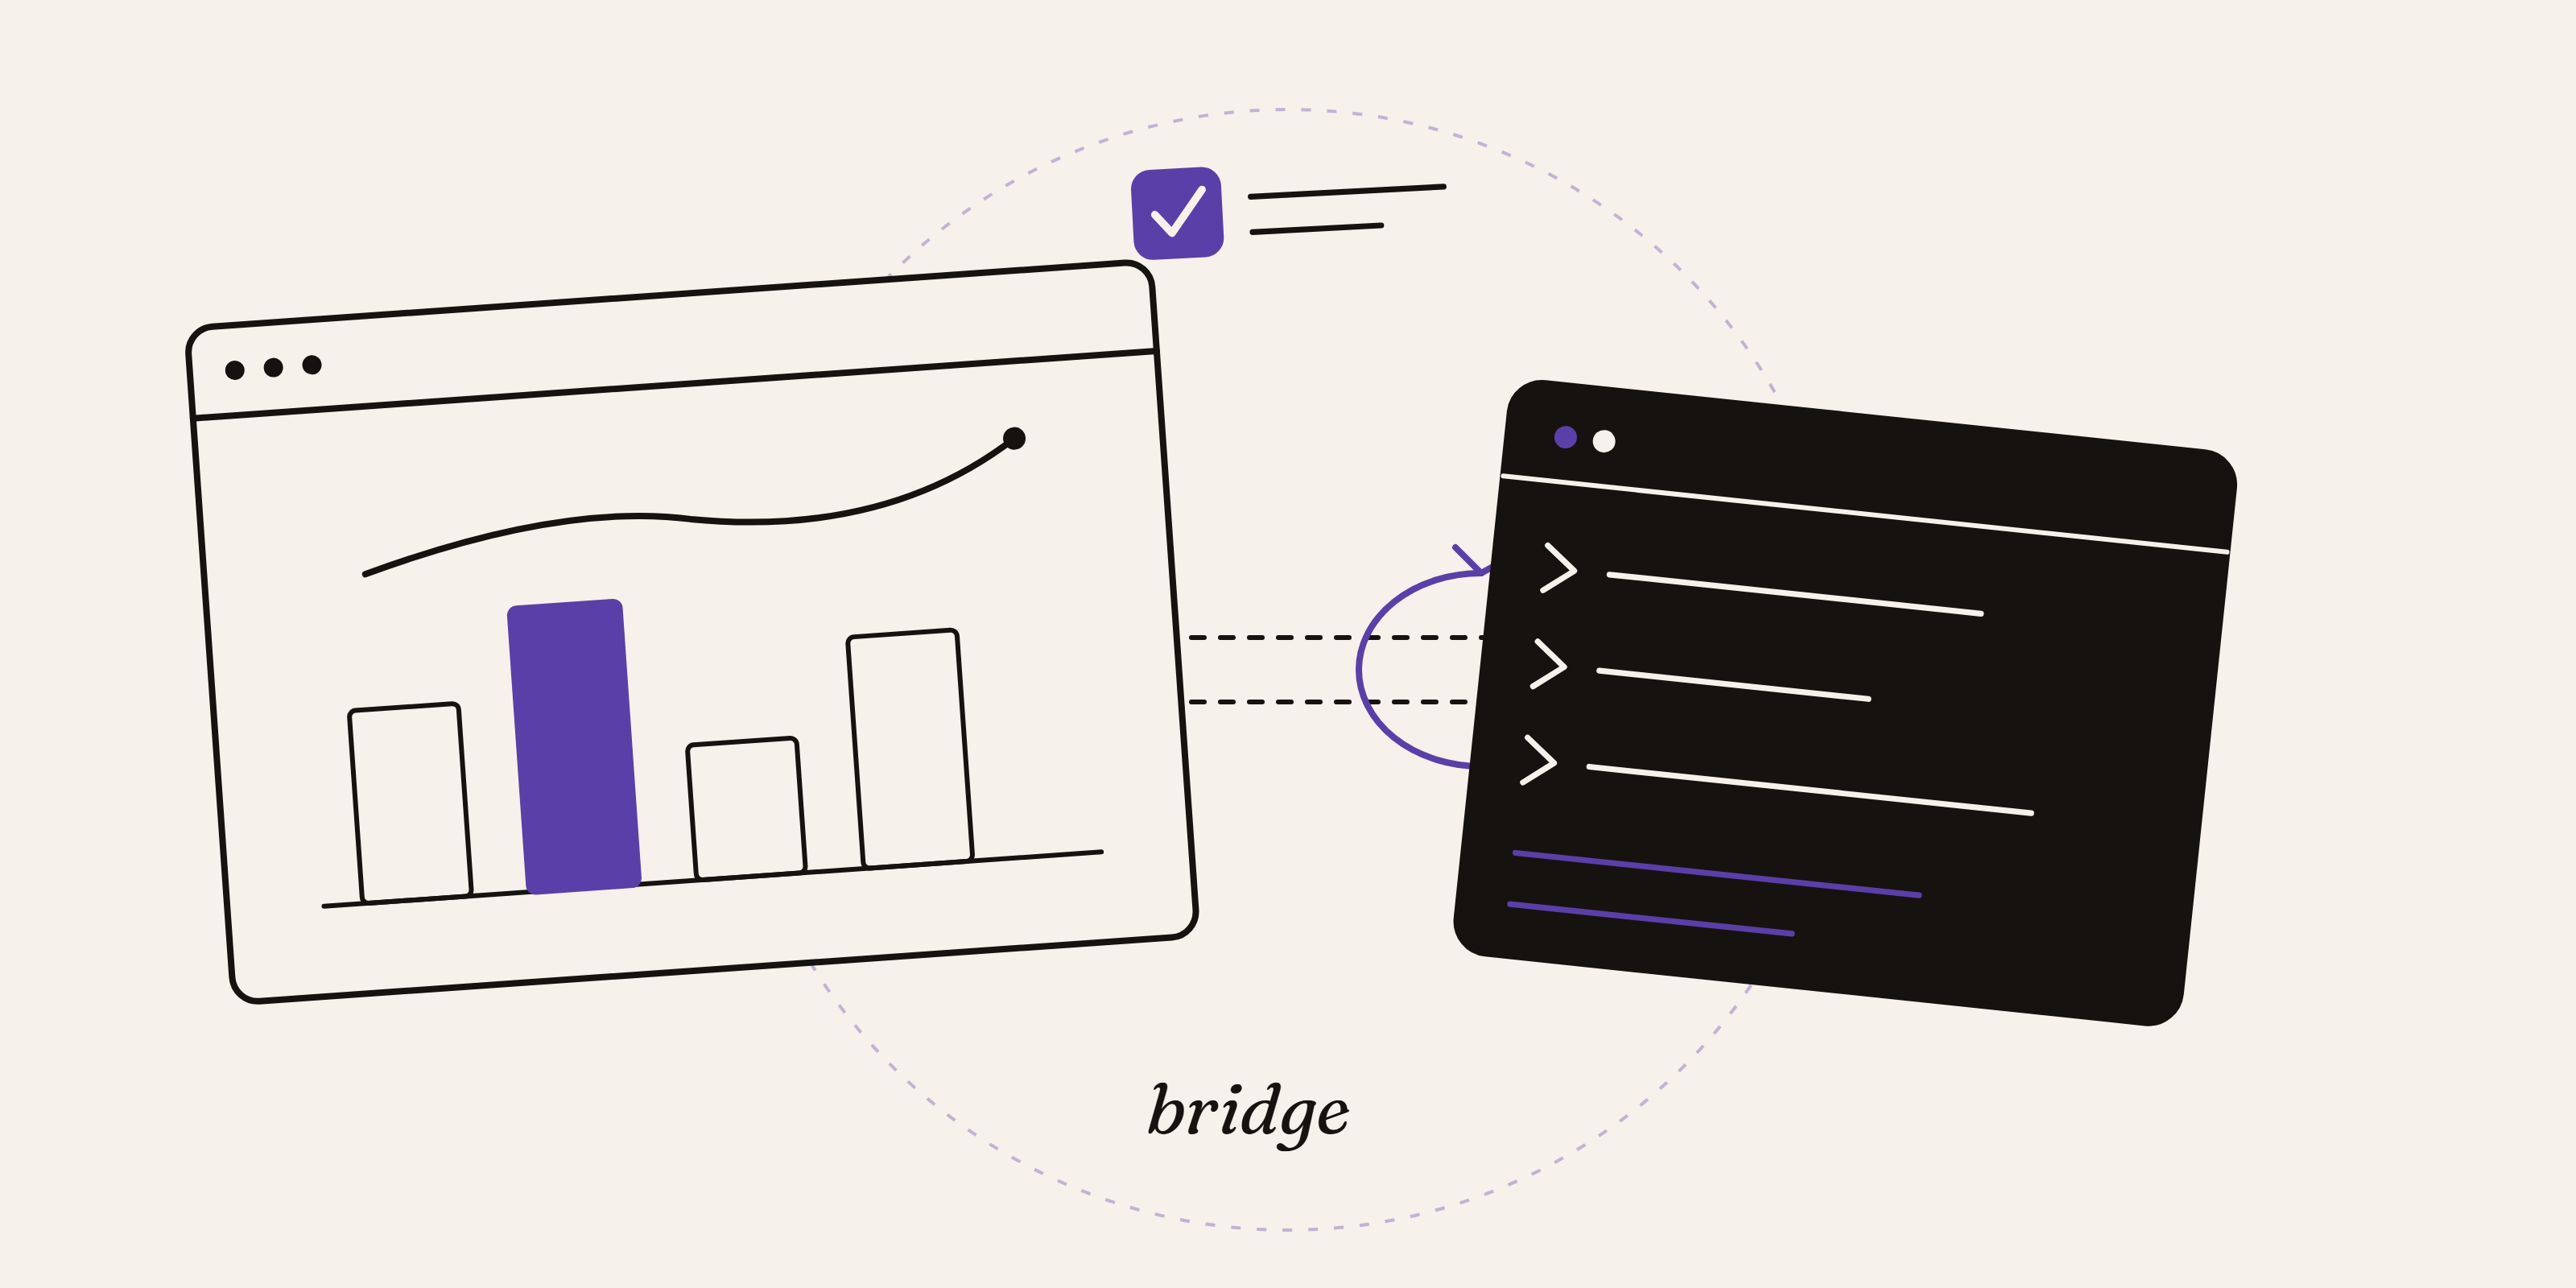
How to enable the Power BI Desktop Bridge (and the CLIs the docs leave out)
The June 2026 Power BI Desktop Bridge lets an agent build and verify reports. Here is how to enable it and install the two CLIs the docs lea...

10 Practical Steps to Automate Your Business Processes
Ten practical steps to automate your business processes without AI hype. Start small, fix the process first, use the tools you already own, ...